To open long positions on EUR/USD, you need:
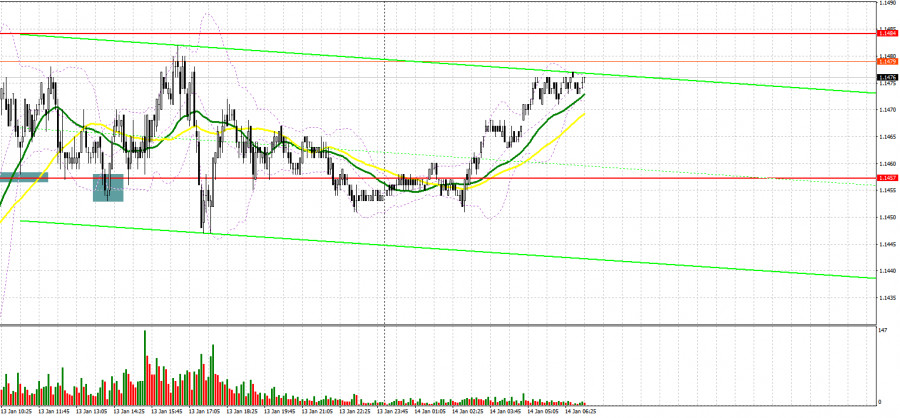
Yesterday, several signals were formed to enter the market. Let's look at the 5-minute chart and figure out what happened. In my morning forecast, I paid attention to the 1.1457 level and advised him to make decisions on entering the market. After a good growth on Wednesday, euro bulls took only a short pause and by the beginning of the European session on Thursday continued to push the pair up. A breakthrough and a reverse test from top to bottom of the 1.1457 level led to forming a signal to buy the euro. As a result, the pair grew by 20 points, after which demand sharply dropped. Everyone was waiting for the US inflation data, which was disappointing. The next formation of a false breakout at 1.1457 in the afternoon and a signal to buy the euro led to an increase of 30 points, but it was not possible to rise above the level of 1.1480.
From a technical point of view, little has changed for today's European session. Bulls continue to have an advantage and all they need is good data on the eurozone. The primary task is to protect the 1.1453 support, which worked well yesterday and on which the moving averages playing on the bulls' side are passing. The formation of a false breakout there and good data on the Italian consumer price index, France's foreign trade balance and the eurozone's foreign trade balance can push the euro to rise to yesterday's high of 1.1484. Crossing this range is still an important task, and the reverse test from top to bottom will open up the possibility of a new jump to the levels: 1.1514 and 1.1562, where I recommend taking profits. The 16th figure will be a more distant target. However, you should not count on such a large increase in the euro until a divergence is formed on the MACD indicator. Be careful with buying at the highs. With the pair declining during the European session and the lack of bull activity at 1.1453, it is best to postpone long positions to a larger support of 1.1426. However, I advise you to open long positions there when forming a false breakout. From the 1.1397 level, you can buy EUR/USD immediately for a rebound while counting on an upward correction of 20-25 points within the day.
To open short positions on EUR/USD, you need:
The bears defended the resistance of 1.1480, but this is not enough. To build a downward correction, a return to the level of 1.1453 is required. In case of EUR/USD growth during today's European session, bears can count on the divergence that has formed on the MACD indicator and which may indicate the end of the bullish wave observed this week. However, to implement it, you will need to protect resistance at 1.1484. Rising above this level will lead to a succeeding bull market, which will be difficult to stop. Forming a false breakout at 1.1484 creates the first entry point into short positions while expecting a return of pressure and a decrease in EURUSD to the intermediate support area of 1.1453. A more active struggle will unfold for this level, however, in case bulls are not active, you can count on its breakthrough. The bottom-up test of 1.1453 will provide another signal to open short positions with the prospect of falling to a large low like 1.1426, just above which the moving averages playing on the bulls' side pass. Going beyond this range will change the market direction to a downward one and demolish a number of bulls' stop orders, which will cause EUR/USD to fall to the lows: 1.1397 and 1.1357, where I recommend taking profits. In case the euro grows and the bears are not active at 1.1484, it is best not to rush with short positions. The optimal scenario will be short positions when forming a false breakout in the area of 1.1514. You can sell EUR/USD immediately on a rebound from the 1.1562 high, or even higher - around 1.1607, counting on a downward correction of 15-20 points.
I recommend for review:
The Commitment of Traders (COT) report from January 4 revealed a sharp increase in long positions and contraction in short positions that had an impact on the negative delta's value. It indicates that the market is changing its sentiment and demand for EUR has recovered despite the Fed's hawkishness and its shift towards aggressive monetary tightening. The highlight of the week is an inflation report from the US. The US CPI is expected to jump above 7% in December. Investors will revise their portfolios following the inflation report. Fresh evidence of soaring inflation will push the US central bank into raising interest rates sooner than later. Another thing is that the US labor market is improving steadily. In this context, we can reckon that the US regulator might increase interest rates at least 4 times this year. The ECB is going to withdraw its emergency bond-buying program in full in March 2022. However, the regulator does not plan other moves towards tightening its monetary policy. This dovish stance caps the upside potential of risky assets. According to the last COT report, long non-commercial positions grew to 199,073 from 196,595 for the week. At the same time, short non-commercial positions dropped from 206,757 to 200,627. It proves that traders are poised to add long positions on EUR/USD bearing in mind a further upward correction of EUR/USD. By and large, the overall non-commercial net positions declined from -10,162 to -1,554. EUR/USD closed last week a bit higher at 1.1302 against 1.1277 a week ago.
Indicator signals:
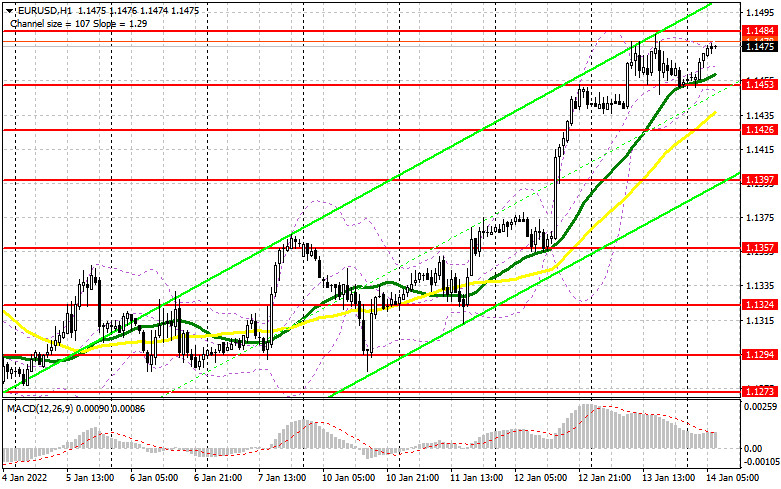
Trading is above the 30 and 50 daily moving averages, indicating a rise in the euro in the short term.
Moving averages
Note: The period and prices of moving averages are considered by the author on the H1 hourly chart and differs from the general definition of the classic daily moving averages on the daily D1 chart.
Bollinger Bands
In case of a decline, support will be provided by the lower border of the indicator in the area of 1.1453. Crossing the upper border of the indicator in the area of 1.1485 will lead to a new wave of growth.
Description of indicators
- Moving average (moving average, determines the current trend by smoothing out volatility and noise). Period 50. It is marked in yellow on the chart.
- Moving average (moving average, determines the current trend by smoothing out volatility and noise). Period 30. It is marked in green on the chart.
- MACD indicator (Moving Average Convergence/Divergence — convergence/divergence of moving averages) Quick EMA period 12. Slow EMA period to 26. SMA period 9
- Bollinger Bands (Bollinger Bands). Period 20
- Non-commercial speculative traders, such as individual traders, hedge funds, and large institutions that use the futures market for speculative purposes and meet certain requirements.
- Long non-commercial positions represent the total long open position of non-commercial traders.
- Short non-commercial positions represent the total short open position of non-commercial traders.
- Total non-commercial net position is the difference between short and long positions of non-commercial traders.