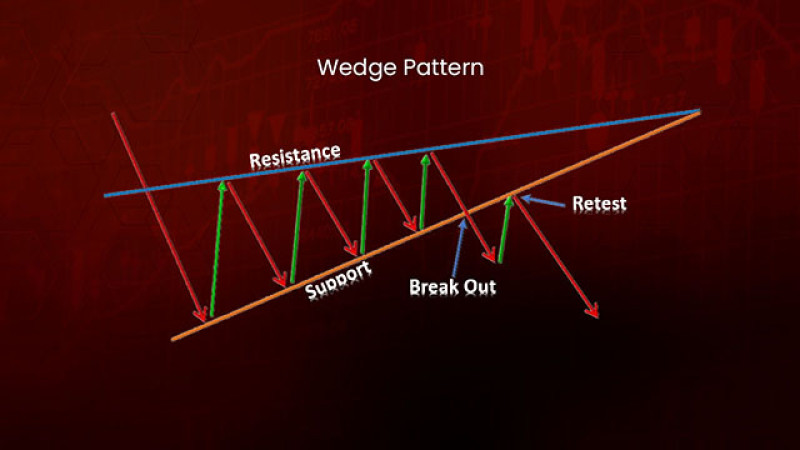
What information can chart patterns provide? The answer to this question can be found in the article Technical Analysis Patterns.
In this article, we describe what role the Wedge pattern plays in trading, what types of it there are, and how to use it correctly. Read on to learn the most important things about this pattern.
Interpretation
Traders who have some knowledge about chart pattern can predict the market situation. And the forecast, in turn, is necessary for successful trading.
On the one hand, the Wedge pattern is not one of the most popular in Forex and other markets. But on the other hand, many traders prefer this pattern thanks to its informativeness and ease of use, when finding various assets on charts.
In addition, this pattern is also characterized by high accuracy, which plays a significant role in trading. That is, if traders manage to identify this pattern correctly, the probability of incorrect interpretation of its signals is reduced to almost zero.
On the chart, the pattern resembles a cone or a triangle. Prices fluctuate in a range, which gradually narrows and slopes either up or down.
It is also important to note that the pattern is formed following a clear trend, not a flat market.
The key features of the pattern are:
- The boundaries of the trading range connect the extremes, at least two on each side. These lines are directed towards each other, that is, directed to one point.
- The price channel is not located horizontally, but at an angle. It is this property that distinguishes the Wedge pattern from the Triangle.
- Inside the pattern, at least three waves are formed that reflect price fluctuations. As practice shows, the number of waves is always odd.
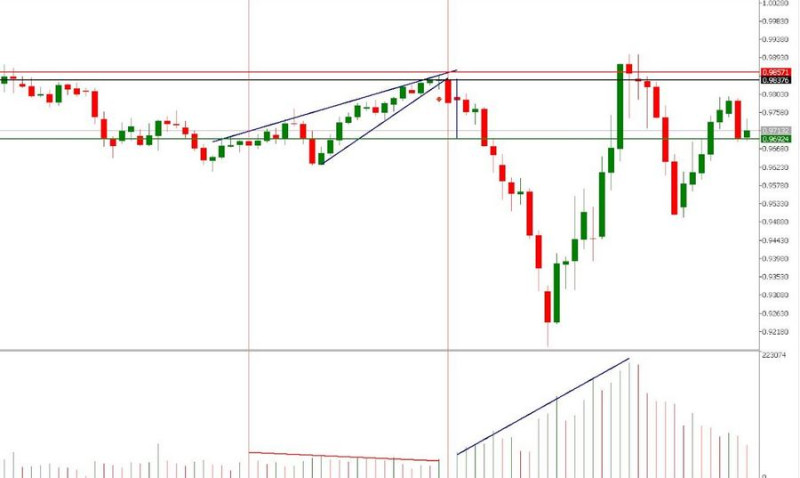
- While the price range narrow, the trading volume falls as well. The growth of the latter indicator occurs only after a breakout.
- Unlike the Pennant and Flag formations, the Wedge pattern does not have a flagpole, which is formed due to price impulse.
- Inside the Wedge, the price touches each of the levels at least three times.
- The pattern appears amid a clear trend and is not a short-term one. Its formation usually takes about a month.
- The pattern is considered completed, when a price breaks through its boundaries.
- It is most effecient on H1 and H4 time frames.
The specific feature of the Wedge formation is that it can warn traders about either trend continuation or trend reversal. It all depends on the moment it appears.
We will provide more details about it below. Meanwhile, let us explain under what conditions this pattern is formed on a chart.
The price of any asset depends on supply and demand. This ratio, in turn, is formed based on the activity of sellers and buyers.
Every market participant seeks to conclude the most profitable deals. And when the activity of one of them increases, the vector of extreme points goes up or down, while pullbacks are reduced.
The updating of extrema during the formation of each wave is an important feature of the pattern. It indicates that sellers lack the potential to change the price to the level of previous values.
Rising Wedge pattern
As the name suggests, this type of the wedge is upwards. It means that lows and highs within this pattern are constantly rising, nearing each other.
An important feature is that the support line moves up faster than the resistance line, although both are aimed at the same point.
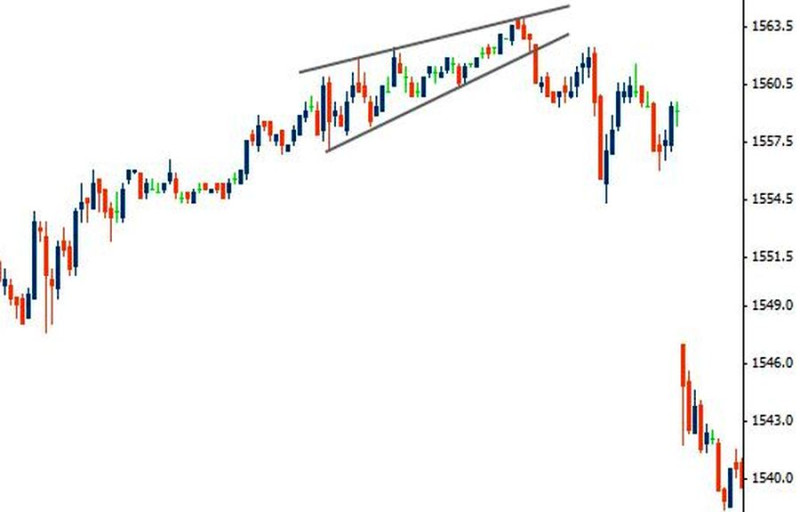
In most cases, the figure appears at the peak of bullish dynamics, after which the quotes change the vector of movement and plunge.
That is, in this particular situation, we are referring to a reversal of a bullish trend. After a breakout, it changes to bearish, as shown on the chart.
However, the Rising Wedge can also appear in a bearish market. Inside the formation, quotes move against the main vector, but after a breakout, the movement continues in the direction of the trend.
In this case, the pattern signals the continuation of the trend. An example is shown in the screenshot below.
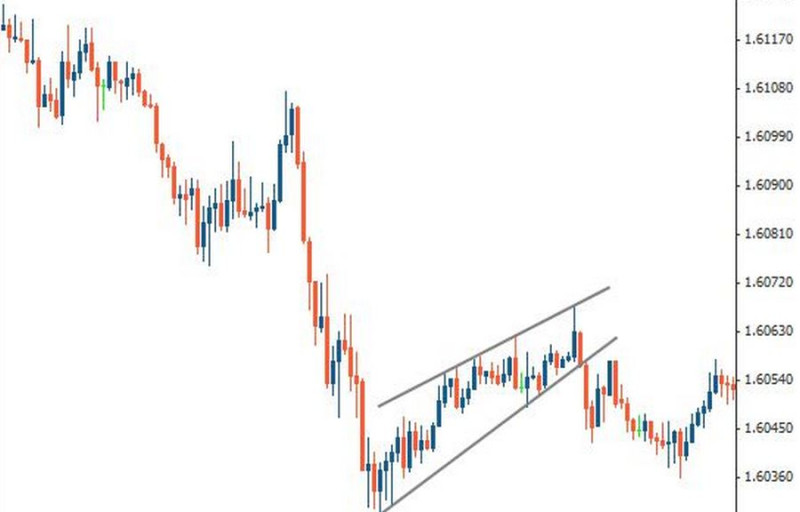
In both cases, the formation of the pattern completes when the lower trend line is broken. At this moment, sell trades are reasonable, because according to the received signal, the price may subsequently fall.
There are several trading scenarios when the Rising Wedge appears on a chart.
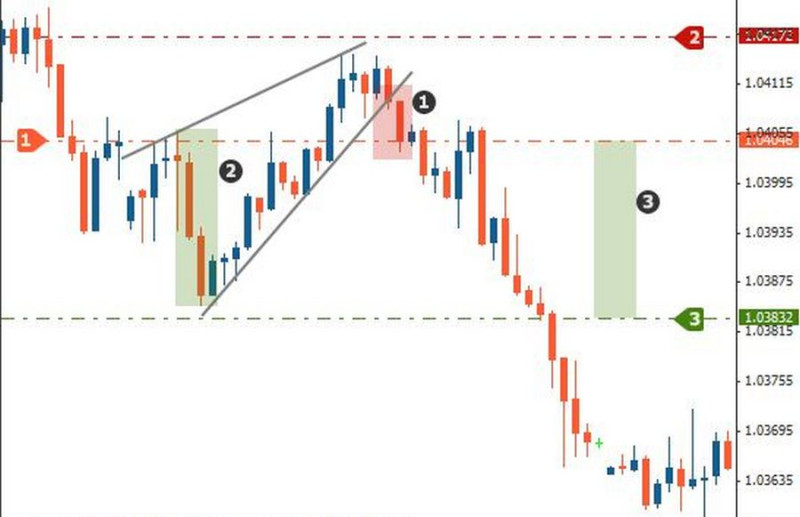
Strategy No 1 implies that traders open sell positions shortly after the price breaks the support level, that is, below the lower boundary of the pattern. To reduce risks, they can do it after a candlestick closes below the line.
A stop loss should be set above the upper line of the pattern to avoid losses in case the price starts to move contrary to the forecast, that is, upwards.
A take profit should be set below the cross point at the largest distance between target lines within the pattern.
In the chart below, the entry point is marked with an orange line, a stop loss is red, and a take profit is green.
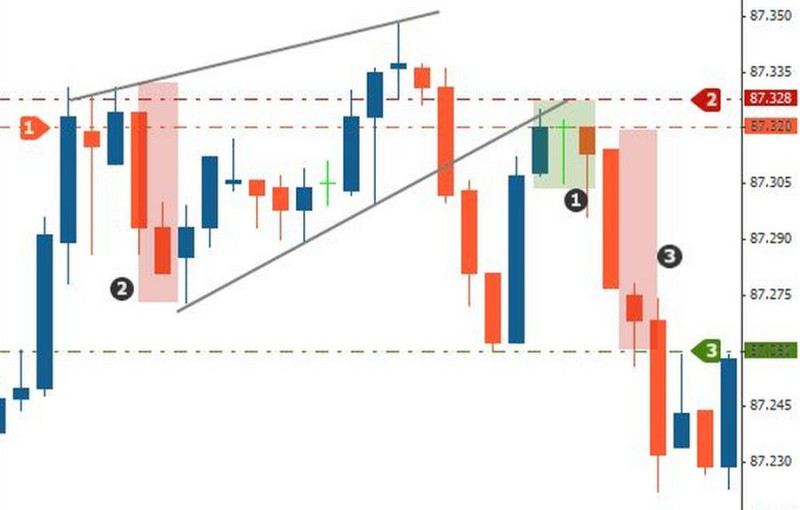
According to strategy No 2, a sell trade should be opened immediately, after a retest of the pattern lower line that turned from support into resistance.
In this case, a stop loss should be set above it, and a take profit should be placed according to the same principle as when implementing the first strategy.
On the chart, the limit orders are indicated by red and green lines, respectively.
So, the ascending pattern on a chart indicates that the asset is worth selling, because the price is likely to start declining. It does not matter if the pattern appears at the top of a bullish trend or amid a downward movement.
In the first case, it provides a reversal signal, and in the second case it means the continuation. However, in both cases it gives a bearish signal, though the name suggests otherwise.
Falling Wedge pattern
This type of the Wedge is also called descending. Both lines of this pattern are downwards, which explains its name.
On the chart, the lows and highs are sliding, and the distance between them is gradually decreasing. At the same time, the resistance level goes lower than the support line.
As in the case of the ascending pattern, the Falling Wedge can indicate either a reversal or a continuation of the trend. It all depends on where it gets completed.
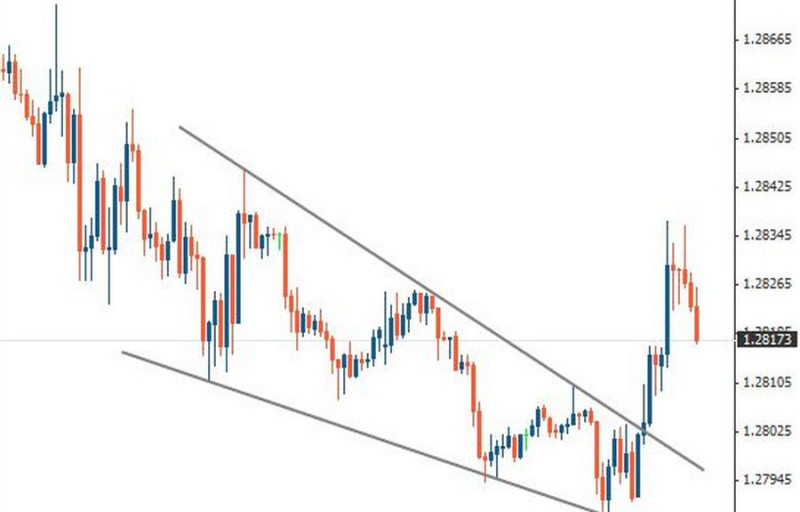
In particular, if the Falling Wedge appears during a bearish trend, then the momentum weakens and the price is likely to start rising soon. That is, the bearish movement will be replaced by the bullish one, which is shown on the chart.
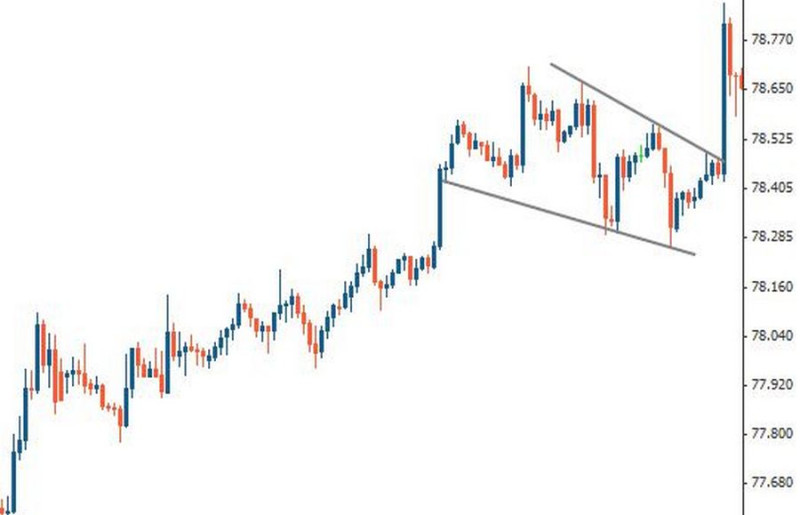
When the Falling Wedge is formed during a bullish trend, then it means that the dynamics is likely to continue after the breakout.
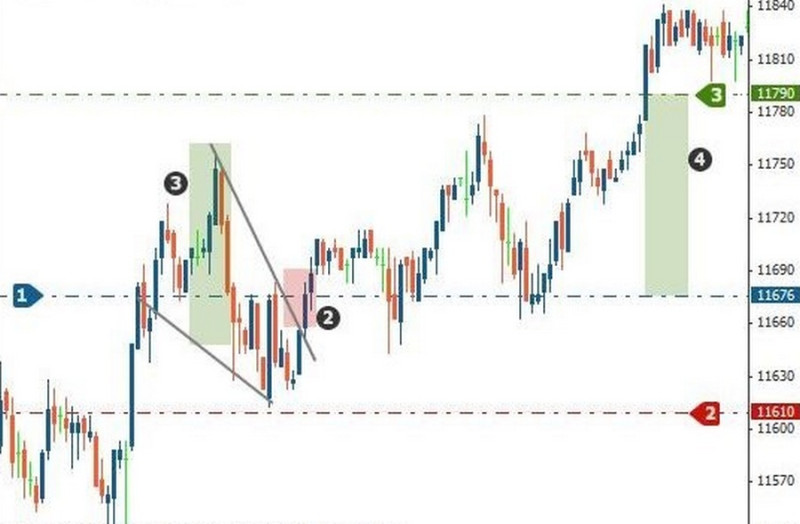
In both cases we have described long positions will be appropriate. Let's take a look at the different ways to open them.
Strategy No 1: when implementing it, you need to wait when the price breaks the upper boundary of the patter and a candlestick closes above this level. A stop loss should be placed below the support line, which coincides with the pattern line. A take profit should be set above the breakout point.
On the chart, a stop loss is marked with a red line, and a take profit is marked with a green one.
Strategy No. 2 involves opening a long position after a retest of a broken level that turned into a support zone. The points for placing a stop loss and take profit are shown on the chart. A stop loss is indicated by a red line, and a take profit is marked by a green one.
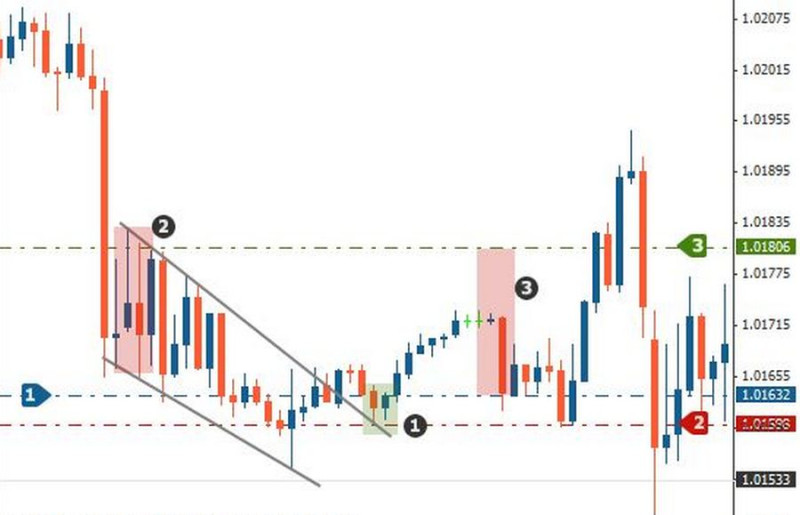
Summing up, we can conclude that the Falling Wedge signals that the market will be dominated by a bullish trend. If the pattern appears during bearish dynamics, the trend is expected to reverse, if it appears in a bullish market, the trend is likely to continue.
That is, in both cases, a trader is recommended to buy an asset where this pattern appeared. After all, the price is most likely to move upwards in the short term.
Formation of the pattern
To better explain the essence of this pattern, let us provide more details on the fundamental factors of its formation. As examples, we will use different types of patterns on uptrends and downtrends.
- The Rising Wedge in a bear market: the appearance of this pattern amid falling prices indicates that the downtrend will continue.
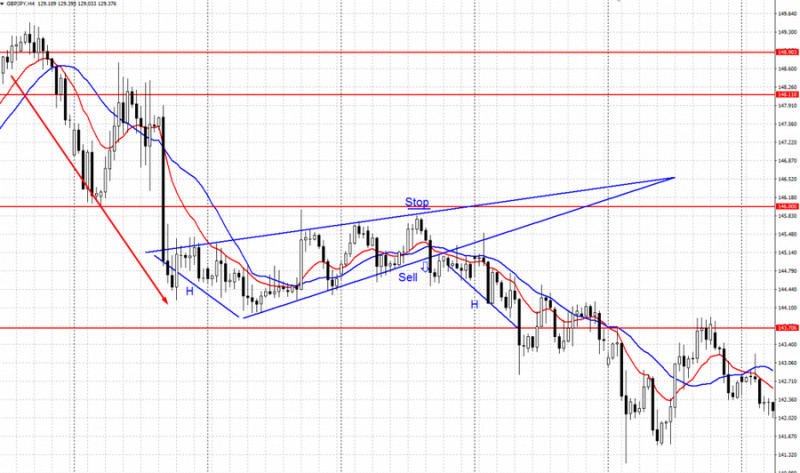
While the pattern forms, the market situation develops in the following way:
- The clear downward momentum is weakening, while the trading volume is decreasing. Bears do not have enough potential and strength to continue the downtrend with the same intensity.
- There is a local price impulse, and bulls take control over the market, raising quotes. But the further growth is limited by the resistance of the bears, thus there is a formation of a new upper extremum.
- Bears' efforts send the price down, but there it faces the resistance of bulls. A new lower extremum is being formed, because the low trading volume does not allow reaching the previous one.
As a result, the first wave is formed on a chart. - The situation repeats, resulting in a second wave. But its height is lower than the previous one due to the formation of new extrema.
- The wave formation continues until the price moves out of the narrowing range. When this happens, the price first falls to the first low that was fixed inside the figure, and then slides even lower.
- The Rising Wedge in a bullish market: this pattern means that the growing movement has reached a peak and in the short term there will be a breakout of the vector.
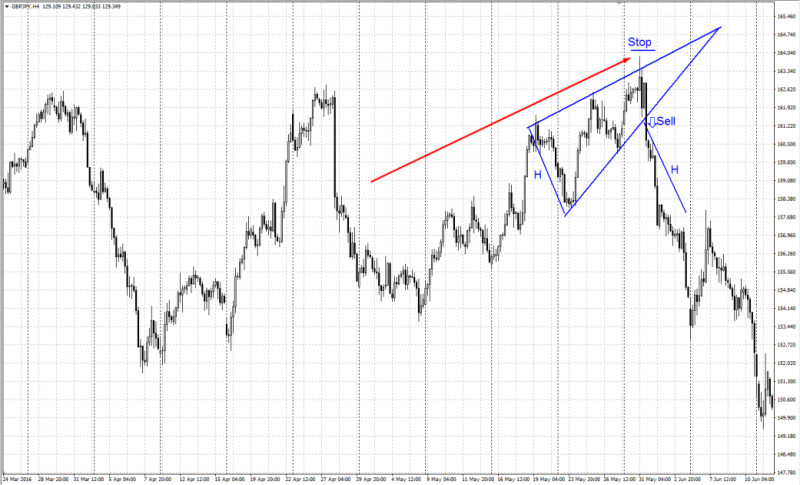
Stages of the pattern formation:
- The price reaches the highest level but bulls lack momentum to push it higher. At the same time, bears limit further growth.
- Sellers push the price down, as a result of which a new lower extreme is formed on the chart.
- Further attempts of consolidation made by bulls and bears lead to the formation of new waves on a chart. Due to insufficient momentum, the price channel is becoming narrower.
- When the bears get the volume they need, they reverse the trend.
- Quotes take a nosedive, that is, a bearish reversal occurs.
- The Falling Wedge in a bullish trend: visually, there is a transition from a clearly defined growing movement to the stage of trading down.
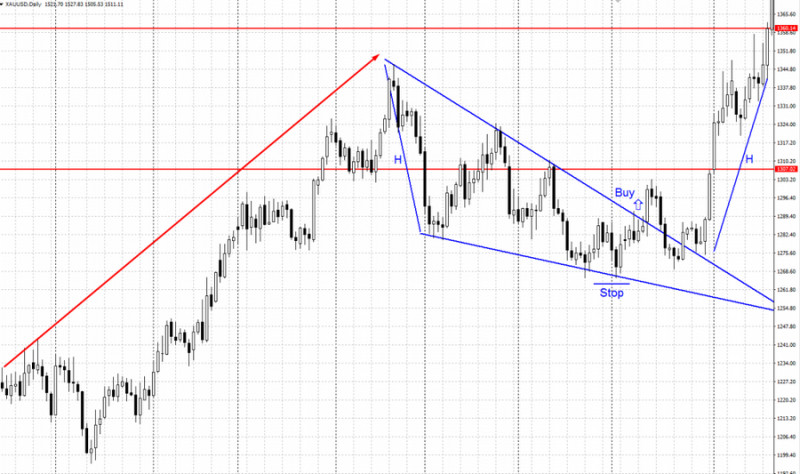
There are the following developments on the market:
- The price reaches a peak, but at this point, the bulls' opportunities face bears' resistance. As a result, quotes slide down.
- The bears' potential is enough for a chart to form a new swing low.
- After that, the price rebounds from the support line, rushing up again. The formation of a new maximum and, accordingly, the first wave gets completed.
- The next wave is not only lower than the previous one, but is also characterized by falling maximum and minimum extremes.
- Following the next wave, the resistance line is broken and the price starts moving up, in the direction of the initial trend;
- The Falling Wedge in a bearish trend: as already mentioned, a reversal occurs after the formation of this pattern.
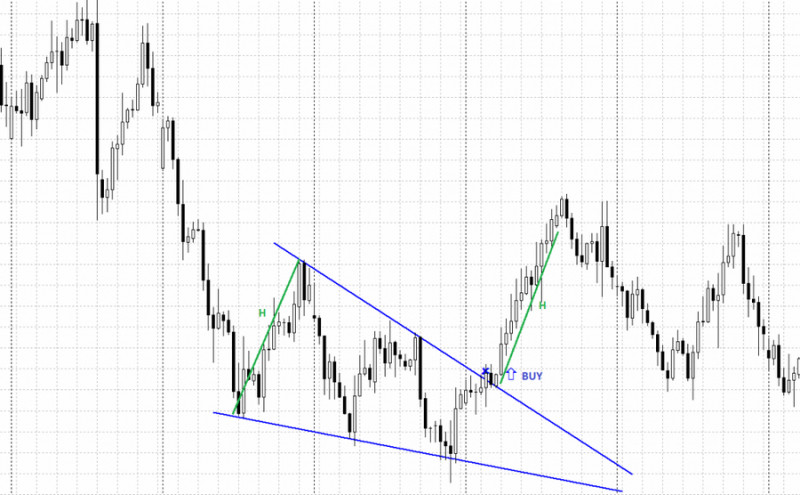
In this case, there are the following developments in the market:
- The price moves in a downtrend. At some point, it bounces off the formed extremum, being pushed up by the bulls.
- Under the buyers' influence, the price corrects to the upside.
- Subsequent highs and lows are formed lower and lower, while the wave height decreases.
- Quotes break through the resistance level and move up.
The formation of different variants of the pattern shows that it is market participants, bulls and bears, who play the key role in changing the price of any asset. It is their activity or, conversely, passivity, that sets the vector for further price movement.
The Wedge pattern: trading
Above, we have already explained what strategies can be used while trading with the use of the Wedge pattern. Now let's take a closer look at the general principles and rules of trading when using this pattern.
Regardless of what type of a pattern appears on a chart, a trader needs to follow a certain algorithm:
- Determine the price direction, that is, the main trend. If the market is flat, you'd better not waste time and effort looking for a pattern.
- Identify the Wedge. To do this, make sure that it meets all the conditions mentioned at the beginning of the article.
- Plot trend lines that will connect the extremes, that is, the maximum and minimum prices of the anticipated pattern.
- Use the Stochastic Oscillator or the Relative Strength Index to identify possible divergence.
- If you have found the Falling Wedge, wait for a breakout of its boundaries and open a long position. Conversely, go short in case of confirmation of the opposite pattern.
- Set a stop loss and a take profit.
After going through these stages, a trader will only have to fix profits.
At the same time, it is important to understand that the Wedge trading methods can be either conservative or aggressive. We described both variants in detail when writing about rising and falling pattern trading strategies.
Now let's just briefly explain the difference between them.
Supporters of a conservative method open positions only after the level is retested. That is, they wait for the moment when, the price sets a new minimum or maximum after a breakout, and then returns to the broken line and rebounds from it.
Meanwhile, aggressive traders open positions immediately after a breakout. In this case, the potential profit is bigger, but the risk, respectively, is also higher.
Beginning traders should be very cautious when using aggressive trading techniques. This category of players can apply such strategies them only when trading small volumes. This way, they can avoid hefty losses in case of failure.
Pros and Cons
When using any particular pattern of technical analysis in trading, it is important to know about its advantages and disadvantages. Indeed, along with the outward simplicity of the formations, there may be some specific features directly affecting trading results.
First, let us enumerate the advantages of the Wedge that make this pattern quite popular with many traders. Here they are:
- It is universal, as it can appear on charts of any markets such as forex, stock, cryptocurrency, and other. That is, this pattern can be used while trading various assets.
- It can be applied on any time frames. However, it shows more reliable results on longer time frames.
- This pattern is highly informative as it provides traders with details about the future price movements and the optimal entry point. Also, the pattern allows traders to set the stop loss and take profit levels correctly.
- It provides an opportunity to trade in compliance with the principles of risk management.
- This pattern is not a complex one, so it is easily recognizable.
Drawbacks of the Wedge:
- Double reading of the pattern, as it can signal both reversal and continuation of a trend. To avoid mistakes, a trader needs to identify the pattern type: whether it is a rising or a falling one. Also, it is important to define the current trend.
- The Wedge pattern, in particular the falling one, requires confirmation.
- The Wedge looks similar to other patterns such as the Triangle. Fast and correct identification of patterns is a matter of training.
If you know about the specific features of the Wedge, you will be able to avoid mistakes that can arise while trading with the use of this pattern. The common mistakes are:
- Misinterpretation of signals. In some situations, novice traders incorrectly identify the pattern type. As a result, they make an erroneous forecast about the future price movement. It is important to remember that this pattern can signal both continuation and reversal of a trend.
- Incorrect setting of a stop loss. Quite often, beginners try to minimize potential risks by setting a stop loss at the minimum distance from the breakout point. But in this case, the position can be automatically closed due to a lack of momentum. As a result, instead of the expected profit, a trader may incur a loss. Further movement according to the forecast in this case will no longer matter.
- Making trades of big volumes in violation of the principles of risk management. It is recommended to increase the position volume only if there is confirmation of a breakout. Otherwise, we can talk about the formation of a new wave inside the figure. A position opened in such a situation will not only deprive a trader of the anticipated profit, but will also lead to losses that rise proportionally to the trade volume.
So, finding the Wedge on a chart is not enough for a trader to get profit. It is possible to achieve the planned financial success with strict adherence to risk management rules and the prevention of typical mistakes.
How the Wedge differs from other patterns
This review is about only one pattern that can be used in technical analysis. You can read more about other patterns in this article: Full Guide to Reversal and Continuation Patterns
Here, we describe in more details the patterns that are outwardly similar to the Wedge but at the same time have a number of significant differences. This information will help you to correctly identify the patterns on a chart and use them in trading.
- The Triangle is the pattern that is often misunderstood to be the Wedge. Both these patterns are characterized by the narrowing price range, so beginners can recognize them as the same patterns.
In fact, they are not the same. The main distinguishing feature of the Wedge is the slope of both guide lines up or down.
This is not typical of a symmetrical Triangle, for example. The chart shows that its sides are differently directed.
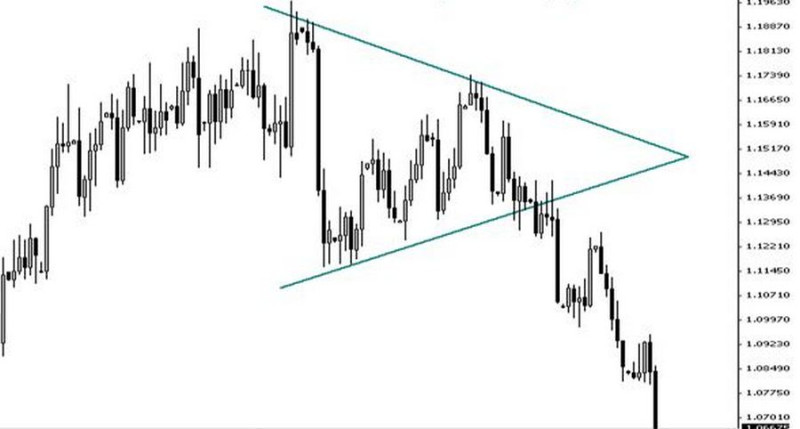
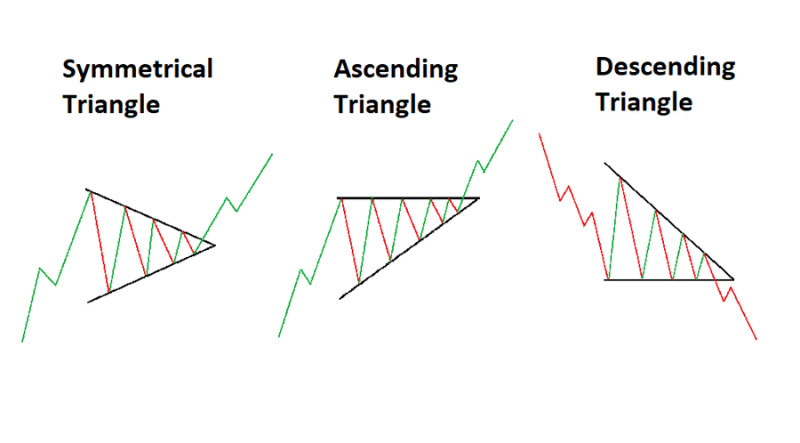
The Wedge has even more differences with the Ascending and Descending triangles.
First, these Triangles are always directed towards the main trend. Second, one of their levels is always horizontal, which indicates the potential of bulls or bears to stop the price without updating extremes.
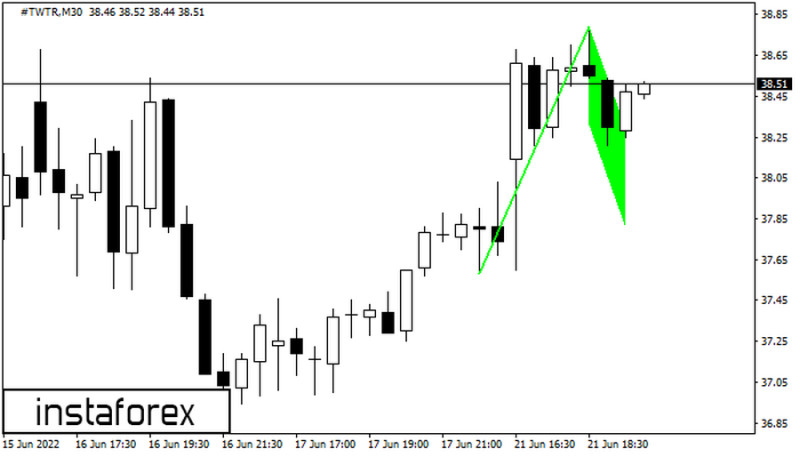
- The Flag is a formation that indicates only the continuation of the trend, and this is its essential distinguishing feature. In addition, in this pattern, the price fluctuates within a corridor bounded by parallel lines, while in the Wedge, these lines approach each other.
Finally, the Flag is attached to a flagpole. On the chart, it looks like one or more long candles. They form an impulse that does not appear before the formation of the Wedge.
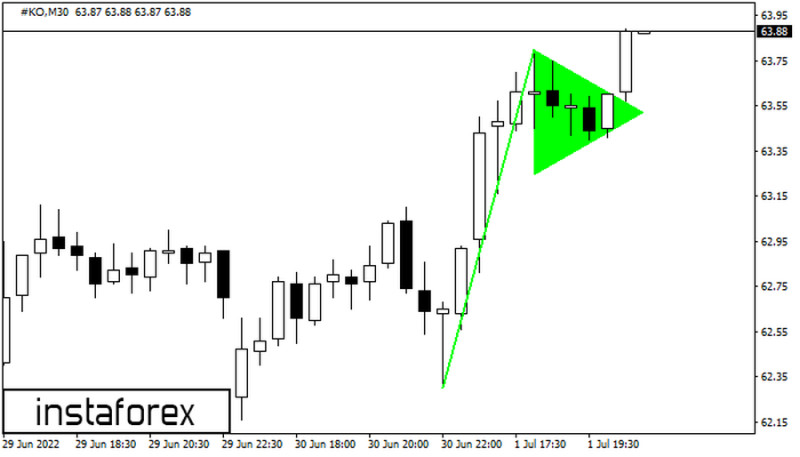
- The Pennant, unlike the Wedge, signals only continuation of the main trend. The Pennant also has the so-called flagpole that is formed by the price impulse.
In addition, the Pennant does not have such a clear slope as the Wedge.
We have listed the main signs that can help traders accurately determine which particular pattern appears on a chart. As a rule, this can be done at the stage of pattern formation, without waiting for the completion of this process.
Conclusion
The key task that the Wedge pattern solves in trading is that is assesses the prospects for future price changes. Specifically, an ascending pattern most often warns a trader that it will be followed by a decline in prices, while a falling one, on the contrary, signals further growth.
At the same time, both types of this pattern can appear in either a bullish or bearish markets.
It can be quite difficult for beginning traders to find this pattern on a chart. First, it appears quite rarely on the charts of some assets. Second, there are many similar formations.
However, training can help traders acquire the necessary skills and make it easier to identify patterns. In order not to risk real money at once, traders can use a demo account available for free at InstaForex.
In addition, you can use indicators that find patterns automatically. For example, it can be the Pattern Graphix algorithm that can be downloaded from the website of InstaForex.
You may like:
Full Guide to Triple Top Pattern
Full Guide to Triple Bottom Pattern
Full Guide to Double Top Pattern
Full Guide to Diamond Reversal Pattern
Full Guide to Head and Shoulders Pattern
Flag Pattern in Technical Analysis
Cup with Handle Pattern: How to Use
Doji Candle: What is it and How to Use?
Full Guide to Pennant Chart Pattern
Gap trading on Forex and stock exchange
Dividend gap: Simple explanation


 Back to articles


