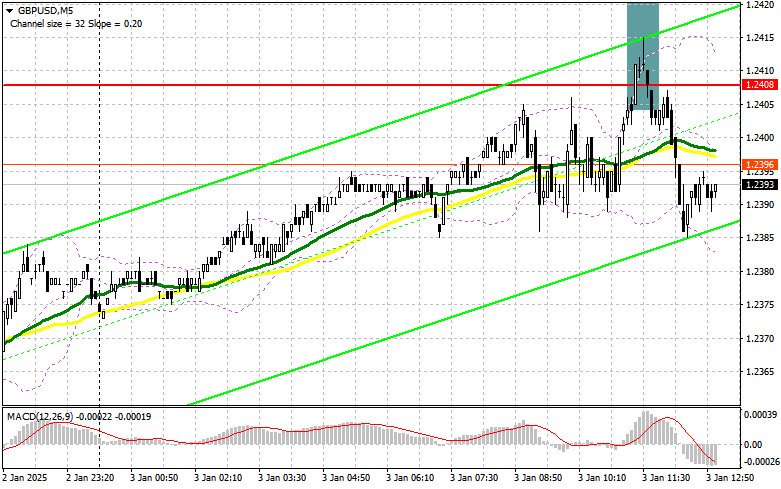
In my morning forecast, I highlighted the level of 1.2408 and planned to base market entry decisions on it. Let's review the 5-minute chart and analyze what happened there. The rise and the formation of a false breakout at this level led to a good entry point for short positions, resulting in a 25-point drop in the pair. The technical picture has not been revised for the second half of the day.
For Opening Long Positions on GBP/USD:
Despite defending the 1.2408 resistance, active pound selling didn't occur in the first half of the day, indicating the absence of large players who had driven the pair down throughout yesterday. In the afternoon, we await key statistics from the US ISM Manufacturing Index, along with a speech by FOMC member Thomas Barkin, which could set the direction for GBP/USD.
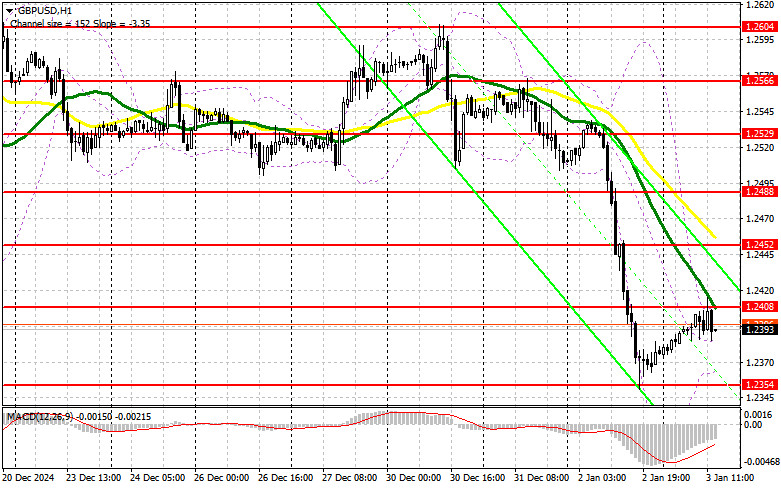
If the pound declines, I expect buyers to emerge around the 1.2354 level, a monthly low that wasn't tested earlier in the day. A false breakout there would provide a good entry point for long positions, targeting a recovery of GBP/USD to the 1.2408 resistance, where the pair is currently trading. A breakout and a retest of this range from above would confirm a new long entry, aiming for 1.2452, where buyers will likely encounter challenges. The farthest target would be 1.2488, where I plan to lock in profits. However, given market conditions, reaching this level seems unlikely.
If GBP/USD falls and there's no buyer activity near 1.2354, buyers will lose momentum, and the bearish trend will likely resume. In this case, a false breakout at the next support of 1.2311 would provide a suitable condition for opening long positions. Alternatively, I'll consider buying GBP/USD on a rebound from the 1.2265 low, aiming for a 30-35 point intraday correction.
For Opening Short Positions on GBP/USD:
Pound sellers are hesitant to act, despite showing some activity near 1.2408. The clear absence of large players threatens the continuation of yesterday's bearish trend. If the pair rises again after data releases, bears will need to defend the 1.2408 level. A breakout above this level could disrupt yesterday's trend, but a false breakout would provide an opportunity to increase short positions, targeting a decline to 1.2354.
A breakout and retest of 1.2354 from below would trigger stop-loss orders and pave the way to 1.2311, which would significantly hurt the bulls' positions. The ultimate target would be the 1.2265 level, where I plan to lock in profits.
If demand for the pound persists after US data and bears fail to act at 1.2408, buyers could trigger a new wave of growth. In this case, bears would retreat to the 1.2452 resistance, where moving averages support sellers. I would sell there only after a false breakout. If there's no downward movement at this level, I'll look for short positions on a rebound from 1.2488, aiming for a 30-35 point downward correction.

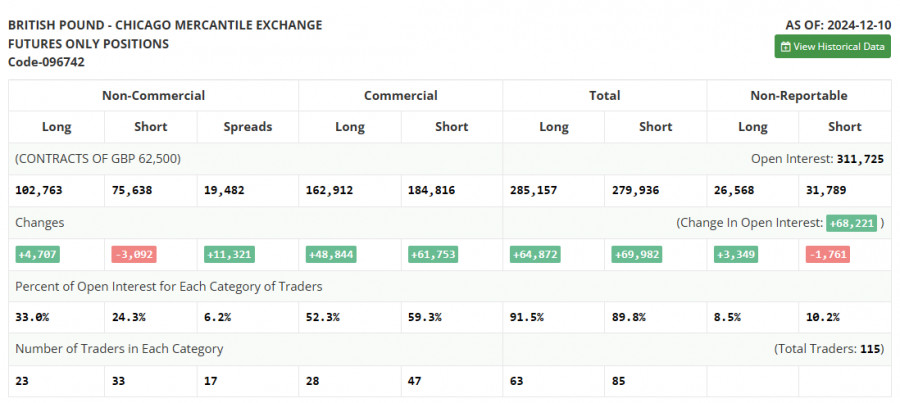
The COT (Commitment of Traders) report for December 10 showed a decrease in short positions and an increase in longs. However, the overall balance of power hasn't changed, as many traders have taken a wait-and-see approach ahead of the Bank of England's final meeting of the year. The decision on interest rates remains uncertain. Recent GDP and inflation data put the regulator in a tough spot, forcing traders to act cautiously. The latest COT report indicated that long non-commercial positions increased by 4,707 to 102,763, while short non-commercial positions fell by 3,092 to 75,638. As a result, the gap between longs and shorts widened by 11,321.
Indicator Signals:
Moving Averages:
Trading is below the 30- and 50-day moving averages, signaling further pound declines.
(Note: The author analyzes moving averages on the H1 chart, which differs from the classic daily moving averages on the D1 chart.)
Bollinger Bands:
The lower boundary of the indicator near 1.2354 acts as support in the event of a decline.
Indicator Descriptions:
- Moving Average (MA): Smooths volatility and noise to indicate trends. Period – 50 (yellow) and 30 (green).
- MACD: Moving Average Convergence/Divergence (Fast EMA – Period 12; Slow EMA – Period 26; SMA – Period 9).
- Bollinger Bands: Measures volatility (Period 20).
- Non-commercial Traders: Speculators like individual traders, hedge funds, and large institutions using the futures market for speculative purposes.
- Non-commercial Long Positions: The total long positions held by non-commercial traders.
- Non-commercial Short Positions: The total short positions held by non-commercial traders.
- Net Non-commercial Position: The difference between long and short positions of non-commercial traders.


