


Do you know anything about the golden ratio? We see it constantly in our everyday life, eg. in nature or in the proportions of the human body.
Curiously enough, we can also encounter it in trading. These are certain patterns that can be discerned in the price movement on the chart. To identify them, traders use Fibonacci retracement levels.
We will talk about this indicator in detail in this article. If you want to learn about other indicators, their types, and how to apply them, we recommend reading the article "Forex indicators".
What are Fibonacci retracement levels?
How did the Fibonacci numbers appear? Famous mathematician Leonardo of Pisa discovered the Fibonacci sequence in the 13th century. It is a set of steadily increasing numbers where each number is equal to the sum of the preceding two numbers.
That's not all. The scientist found out that any two consecutive numbers in the sequence have a ratio of 0.618 if the larger number is divided by the smaller one.
The third pattern is if you take not consecutive numbers but after one, then the ratio between them will be 0.382, and if you take after two, then the ratio will be 0.236.
This is the golden ratio that creates harmony. In nature, everything strives to achieve this harmony. Trading also has certain patterns.
Thus, with the help of these patterns, the Fibonacci retracement levels appeared. It allows you to identify the lines on the chart where a correction occurs. In other words, you can see a price reversal from the main trend.
Lines are plotted on the chart. Depending on where the chart crosses these lines, you can see the current market trend and potential changes.
Usually, traders apply Fibonacci retracement levels if the price moves within a certain trend and its trajectory are clear. When the market moves sideways, the indicator will not be very useful.
During a buoyant price movement, you can clearly see how the price reaches a certain level and a correction begins, that is, a short-term change in the price movement.
After that, the chart shows the continuation of the price movement along the trend. it happens until the moment when the price approaches a pivot level. When it breaks through this level, it can completely change its direction.
Alternatively, the price can break through all pivot levels and continue the current trend.
How to draw Fibonacci lines
The algorithm for drawing Fibonacci lines is quite simple. We have already learnt that they all differ from each other by a certain number: 0.236, 0.382, 0.618, and so on.
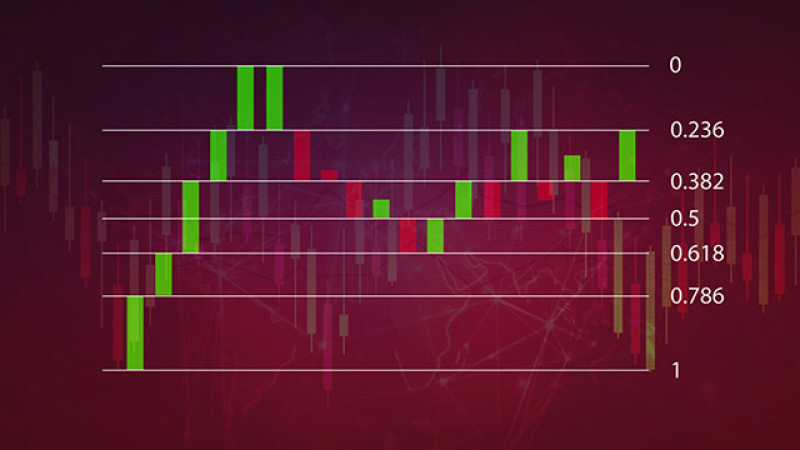
We convert these numbers into percentages and get the following levels: 23,6%, 38,2%, 61,8%, and 78,6%. In addition to these levels, 0% is the start of the retracement and 100% is the end. There is also the middle level of 50%.
The third common ratio for retracements is 50%. Although this is not a number from the Fibonacci sequence but is included in the market analysis.
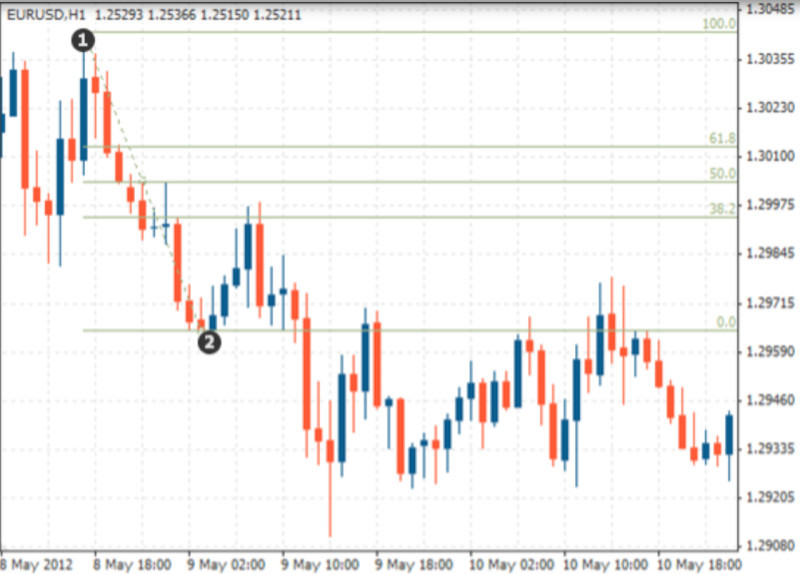
The lines are drawn on the chart in accordance with the above-mentioned numbers. With a bearish price movement, the lines are drawn from the top to the bottom. The 100% point is located at the top and the 0% point is at the bottom.
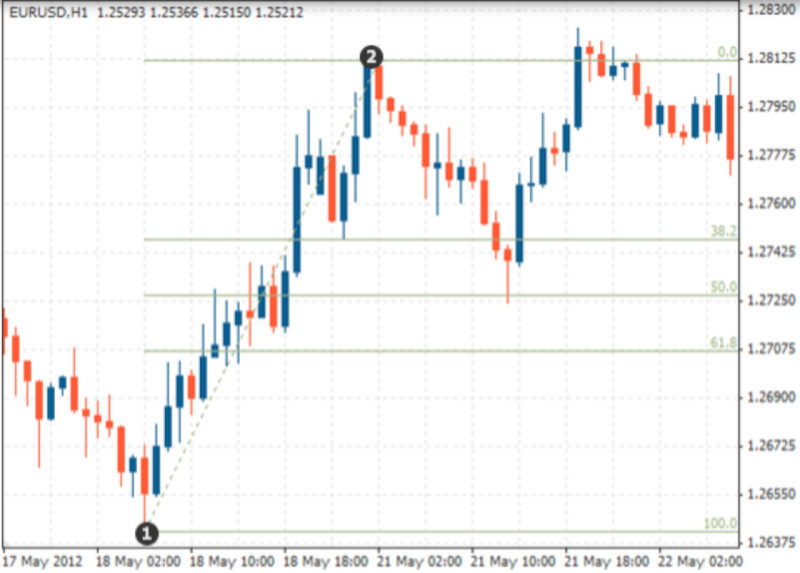
With a bullish price movement, the lines are drawn from the bottom to the top. The 100% level is located at the bottom and the 0% level is at the top.
At first glance, everything seems simple and understandable but many traders have difficulties finding the starting point. This is the moment when the price begins its movement in a certain direction.
There may be several such points on the chart as the price may hit several swing highs or lows during a protracted correction.
At the same time, there are no specific rules for finding the moment when the trend starts. However, there is a recommendation to use different charts when working with different timeframes.
When trading on the M30 chart, you should study the price movements on the chart for the last 10-12 days. On the H1 chart, it is a 2-3-week period.
On the H4 chart, you can analyze data for no more than the last 6 months. When applying the D1 chart, you can analyze the price movements for no more than 2 years.
The ending point is the moment when the trend stops, that is, the price starts moving sideways or in another direction.
If the trend continues, the 100% level can not be applied. When the trend is intact, the grid can be tightly aligned.
When using this indicator, traders can choose which levels they are going to use by themselves. They can remove some levels from the chart and add others.
The correct layout of the grid lines is already half the success. If you do it properly, you just need to carefully monitor how the price moves between these lines.
Fibonacci retracement levels
Fibonacci lines are similar to support and resistance levels. However, they are identified according to formulas derived from the ratio of numbers in the Fibonacci sequence.
They are called retracement levels because the price, breaking through the indicated line, starts a correction. In other words, it decreases if it has been growing before, or it rises if it has been declining before.
However, you are working not with two support and resistance levels as this is the case in the classic technical analysis but with six at once. You can see more clearly where the price will stop its movement or rebound.
The most important lines are 38.2%, 50%, and 61.8%. When the price touches these lines, it is likely to stop its movement or perform a reversal.
However, it is better not to open a trade only if the price reaches one of the Fibonacci lines. It would be wise to wait for the signal to be confirmed by some other indicator, for example, a certain pattern on the chart.
If the price breaks through the indicated levels and there are signals that there will be a reversal, then you may open a trade. If there are no other signals, it would be better to avoid new trades.
It is also crucial to understand that the price will not necessarily touch the lines. These levels are used as target ones to predict how far it may go.
Retracement levels are not always clearly indicated on the chart. Nevertheless, if the trend is clear, this indicator works correctly.
Yet, there are also situations when the price hits a level at which a correction may occur. After that, it keeps moving within the current trend.
If other traders also notice this price movement, there will be an increase in positions. As a result, the price will perform a reversal and change its direction.
Fibonacci extension levels
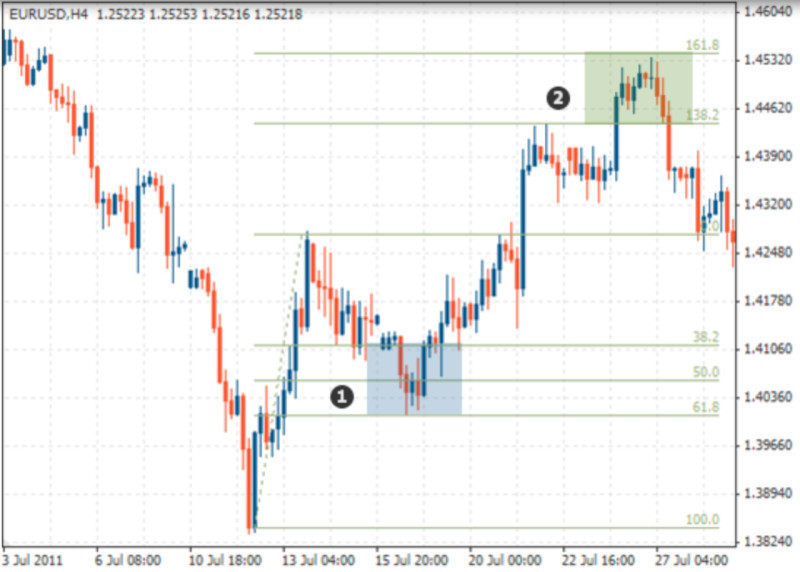
Apart from the retracement levels, which are located between 0% and 100%, traders can add lines that go beyond 100% on the chart. They are called extension levels.
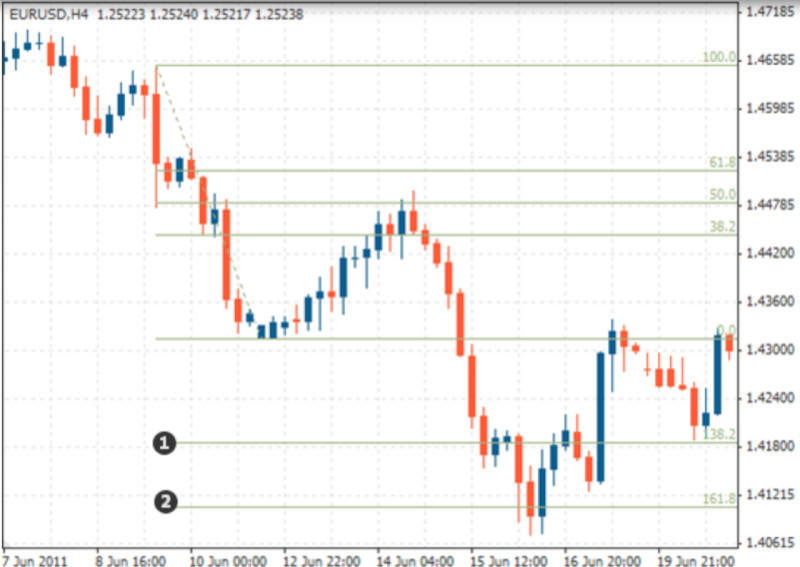
The key Fibonacci extension levels include 138,2%, 161,8%, 200%, and 261,8%, 423,6%. However, there may be a lot more of them.
When applying extension levels, it is important not to overload the chart. It is better to add only the necessary lines to it.
The expansion levels help traders identify the prevailing trend in the future. They are used to lock in profits and open trades against the current trend.
To plot them on the chart, you should understand that these lines are correlated with retracement levels. If the correction occurred at 38.2%, the expansion line at 138.2% will correspond to it.
The retracement level of 61.8% will correspond to the expansion level of 161.8%.
It works exactly this way due to the fact that large traders lock in profits at certain levels. They determine these levels using Fibonacci lines.
They expect that other major speculators will exit the market at the same levels. As a result, they do likewise and this is how these levels may coincide.
The key lines are considered to be 161.8% and 200%. From these levels, the price can make a reversal or change a trend.
If the price breaks through the 200% level, it is necessary to draw again the grid of expansion lines.
Trading strategy based on Fibonacci retracement levels
By analyzing the retracement levels, it is possible to understand whether the price will continue to move further along the trend or perform a reversal. Depending on this, you can build a trading strategy.
There are several options for creating a trading strategy using this indicator. We will discuss the main ones.
The first one is pullback trading. By using this strategy, one opens positions at the end of the correction. There may be several such points as well as there may be several options for choosing the moment for placing an order.
With a more aggressive trading strategy, positions are opened after the end of each correction. It means you gradually open several trades in a row when the price reaches the specified Fibonacci levels.
At the same time, it is better to close positions when the price fails to break through the next target level. Trades can also be closed with the help of Stop Loss orders.
The second option is to enter the market after determining support and resistance levels based on Fibonacci lines. Thus, you need to make sure that the price keeps moving along the trend and only then open a position.
Another strategy is trading with expansion levels. We have already said that in addition to retracement levels, you can also use expansion ones.
They can help you determine the pivot points and how long the trend is unlikely to unfold before it ends.
To multiply profits, you can open a trade at the retracement levels and close it at extension ones.
However, we have already mentioned that it is necessary to wait for the confirmation of other technical signals.
You can look for certain patterns on the chart showing whether the current trend will persist or there could be a reversal.
What are Fibonacci levels used for?
We have already mentioned that the Fibonacci retracement levels are plotted on the chart as a grid. If the lines are applied correctly, you can see how the price breaks through each pivot level.
You should keep an eye on the breakout of levels, their intersection, as well as the failure of the price to approach key levels. Let’s talk about the intersection of the target levels.
The crossing of the 38.2% line gives a signal to traders that the trend is strong enough and is likely to continue. At this level, it is possible to open positions along the trend.
If the chart crosses the 50% line, it confirms the continuation of the trend. If the price does not hit this level, it is likely to either move between the range of 0% and 50% or keep moving along the trend after a correction.
A breakout of the 61.8% line indicates that the trend is strong. The trend could be bolstered by large retail traders or the news release. Although even after reaching the pivot level, the price may perform a reversal.
These lines can also be used as support and resistance levels. The same line can become the support level that later turns into the resistance one and vice versa.
When the price touches a certain level but does not cross it, the line serves as the upper border. In the case when the price breaks through this level, it instantly turns into the lower borders.
So, the next Fibonacci level becomes the upper border.
Expansion levels make it possible to determine target levels for profit-taking or pivot points where the price can change its direction.
Pros and cons
Like any other indicator, Fibonacci retracement levels have both advantages and disadvantages. Let's start with the advantages:
- Opportunity to identify the moment of the price reversal. If the lines are drawn correctly, they clearly indicate potential reversal points or confirm a trend change.
- Suitable for traders of all levels as it is easy to apply and determine pivot points. Hence, investors can use pending orders, which is very convenient.
- Opportunity to work with any timeframes and analyze any asset.
- Built on both mathematical patterns and psychological factors. In addition to the mathematical properties of the indicator, it also takes into account the prevailing market sentiment.
- Compatible with various strategies. This indicator can be used with trend-following strategies and counter-trend ones.
The main drawbacks include:
- Difficulty in determining the starting point of the trend as the line indicating the price movement is not even. It may have several swing highs or lows.
- Opportunity to use it only with a clear-cut trend. This indicator is useless when the market is flat.
- Inaccuracy of signals. Signals are not always accurate as the price may not reach a pivot level or break through a certain line and reverse in the middle of the next price corridor.
- Technical implementation. The algorithm for drawing lines on the chart is quite difficult to build into the code of an expert advisor. Therefore, software with this indicator is rarely used for automation.
Automated Fibonacci levels
In the modern world, people use technology in every industry. Notably, computers are able to perform some tasks better and faster than humans.
For this reason, people fulfill them with the help of computer programs. Trading is no exception. Automated trading is highly popular.
As mentioned above, this indicator is quite difficult to automate. However, it does not mean that it is impossible.
Usually, the Fibonacci retracement levels are plotted on the chart manually. You can choose the appropriate levels, pick the appropriate colors, line widths, and other parameters for them.
The computer program builds levels on the chart automatically based on swing highs and lows. You only need to set in the settings the number of candlesticks that you want to include in the calculation.
If you change the scale or select a different timeframe, the software will automatically rebuild the levels.
As soon as the price hits a new low or high, the software immediately identifies it and rebuilds the grid given the new highs and lows.
However, the automated construction of lines does not mean you should not conduct an analysis.
If you adhere to medium-term trading strategies and you do not need to rebuild the grid often, you can use this indicator without robots and Expert Advisors.
However, if you prefer a more aggressive trading strategy and you change the grid often, it is better to resort to automated line construction. This will help you save time and spend it on analysis.
How to use Fibonacci levels properly
If you want to efficiently use this indicator, you need to follow some rules, as well as be aware of some tricks.
- Appy this indicator only in trend-following strategies when the price has a clear direction.
- It is essential to learn how to correctly determine the starting points for building the Fibonacci levels. Some traders identify the starting points by the body of the bar, others by its shadows. Both options are acceptable. You need to understand which method is right for you and your trading strategy.
- With an upward trend, the grid is applied from the bottom points to the upward ones. In this case, the starting point is 100%, which is at the bottom, and the end point of 0% is at the top.
- With a downward trend, the lines, on the contrary, are plotted from top to bottom. In this case, the starting point is 100%, which is at the top and the 0% point is at the bottom.
- No trend line can be flat. The price tends to rise and then roll back slightly. These are the correction periods that you need to pay attention to. It is the moment when the pullback ends and the price resumes its previous trend. At this moment, you should enter the market.

- Remember that the strongest retracement levels are 38.2% and 61.8%. As a rule, the price rebounds and then starts moving along the trend.
- Trades should be opened at the level where the price starts moving along the trend after a reversal and breakout of the Fibonacci lines. The most profitable positions are the ones made at the first pullback after the start of a new trend.
- For profit-taking, use the next Fibonacci level. Place a Stop Loss order slightly above or slightly below this line depending on the acceptable level of risk.
- As new price extremes appear on the chart, extend the grid to these new levels.
- To check the signals on shorter timeframes, use a higher timeframe. At large timeframes, the signals are more visible.
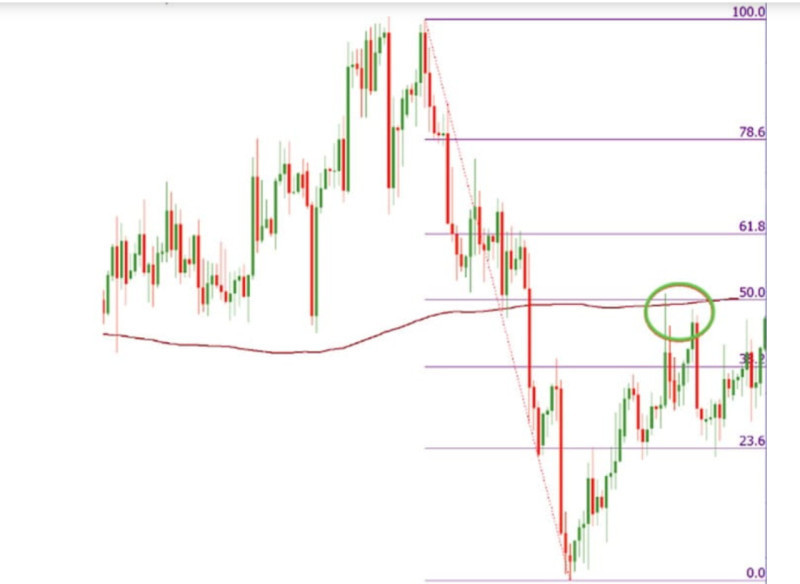
- Use this indicator with other ones. Fibonacci retracement levels work well together with candlestick analysis as well as moving averages and Elliott waves.
- Do not forget to lock in profits after the price breaks through several levels.
- Use the expansion levels as targets for placing Take Profit orders. Usually, it is the lines following 100% – 138.2%, 161.8%, and so on.
Conclusion
In this article, we have outlined the main features, as well as ways to use the technical indicator - Fibonacci retracement levels.
Although the Fibonacci sequence appeared in the 13th century, it is efficiently used by many traders around the world to this day.
Naturally, this indicator is not perfect and has some flaws. However, if used correctly, it can really help you improve your trading results.
The most important thing is to correctly draw the lines on the chart.
It is necessary to use this indicator only during buoyant trading activity as well as wait for confirmation of signals by other technical indicators or patterns on the chart.
When applying this indicator, grid lines are plotted on the chart and the price is moving between them. Traders should pay attention to the breakout of each of these lines.
With the help of this indicator, you will be able to identify corrections when the price starts moving in the opposite direction from the main trend. After the end of a reversal, traders should open positions.
Apart from retracement levels, there are expansion ones. They are used to determine target levels for further price movement.
It is quite difficult to fully automate this indicator. However, it is possible to plot the lines on the chart manually or automatically with the help of specially designed software.
Read more
Bollinger Bands: strategy and way of use
MFI Indicator (Money Flow Index)
Awesome Oscillator: how to use
Support and Resistance Indicator MT4, MT5
VWAP Indicator (Volume Weighted Average Price)
MT4 indicators: how to install and use
Candlestick patterns Indicator for MT4, MT5
Forex volume indicators for MT4, MT5
Forex arrow indicators for MT4


