


Traders can hardly imagine trading on Forex without indicators. The article "Forex indicators" will tell you all about indicators that can be used by both pros and novices.
In this article, we will discuss the Volume Weighted Average Price. This indicator will simplify your trading and make it more efficient. You will find out how it is calculated and who can use it, as well as its types.
About VWAP indicator
The Volume Weighted Average Price indicator came along in the 1980s. However, it gained popularity a decade later, when practice showed how safe it is to use.
This indicator does not promise huge profits, but the risk of losses with it is minimized. These features make it popular with different categories of traders and institutional investors.
The VWAP calculates the average price taking into account trading volumes. The fact that Volume is taken into account distinguishes this indicator from the moving averages (MA).
These two indicators are often compared and considered analogs. However, despite their similarities, volume candlesticks have more weight in the Volume Weighted Average Price, unlike in the case of the SMA.
Let's say you decide to buy fruit: 5 oranges at 2 conventional units each and 10 apples at 1 conventional unit each.
If we use the MA formula, the average cost of fruit will be 1.5 conventional units. That is, the number of the purchased fruit does not affect this indicator in any way.
However, if we apply the VWAP formula, the average price of the purchased fruit will be 1.3 conventional units, which is a fairer figure for the buyer in this case.
In other words, this indicator does not just show the average price but reflects the actual situation in the market.
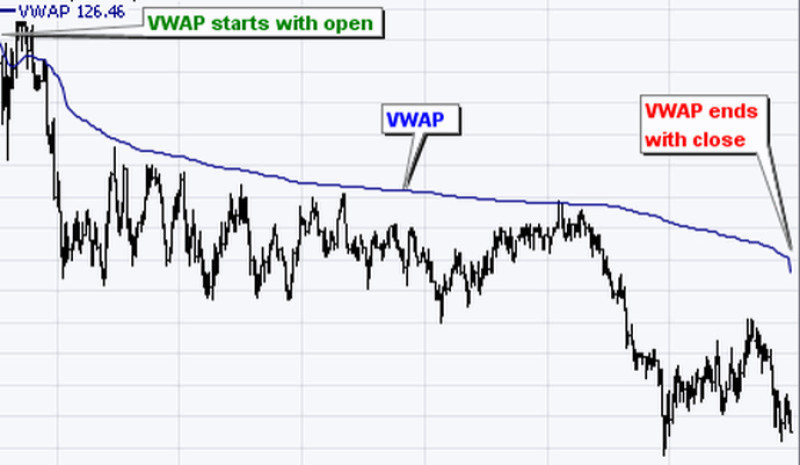
The Volume Weighted Average Price shows you the price of an asset during a certain period of time, namely, how the price changed. The VWAP belongs to the category of trend indicators.
On the chart, it most often represents a line. The remaining lines are standard deviations limiting the price channel.
At the same time, they are only available for paid platform versions and can be removed in the settings only.
When the price is above the indicator line, it is usually an uptrend. When the price is below the indicator line, it is a downtrend. If both lines intersect, the market is flat.
However, such an interpretation applies to long-term trends only. For short periods, the evaluation is done differently.
When you buy a currency at a price smaller than the Volume Weighted Average Price, your trade is considered profitable. That is, if the price is below the indicator line, you can open long positions.
However, other trend indicators should confirm further price growth and not its decline.
When it comes to short positions, the arrangement of lines in this case will be reversed.
Features
So, the VWAP reflects the actual situation in the market.
It is a kind of boundary between sellers and buyers in a certain period of time. If the price is below the VWAP, sellers are stronger. Conversely, if the price is above the indicator, buyers are stronger.
When the indicator moves down, this shows a decrease in demand for an asset. In such a case, a flat in the market may occur.
However, if the indicator moves up, we should expect a stronger trend. You should determine its direction using other tools.
Features of VWAP:
- It shows a value of an asset, weighted by volume. Data is collected from the beginning to the end of a certain period;
- In the process of generating data within a time interval, information is accumulated, but not averaged over time;
- The Volume Weighted Average Price is calculated for a specific period of time. It can be an hour, a day, a week, etc.;
- The most commonly used indicator is the intraday Volume Weighted Average Price;
- Analysis of a VWAP series at different time intervals shows a comprehensive situation in the market;
- It illustrates the level of liquidity, which increases along with growing volumes;
- It works the most efficiently when used in intraday trading and brings good results in high-frequency and long-term trading;
- It helps determine a trend and identify support and resistance;
- On the chart, the indicator is represented as a line, which is smoother compared to the MA;
- The VWAP is an advanced version of the MA;
- Suitable for MetaTrader 4, MetaTrader 5, and many other trading platforms;
- It is most often used in combination with other indicators;
- It is able to accurately and instantly assess the market situation;
- It is applied when trading currencies, securities, indices, etc.
Advantages and disadvantages
There are no ideal technical indicators, and the Volume Weighted Average Price is no exception.
Here are its strengths and weaknesses.
Advantages:
- It shows the current market situation. It is used by traders to see who is in control of the market – bulls or bears – and use this information in trading.
This mostly involves trading with the trend than against it;
- It provides visual data on how demand for a currency changes over time;
- It filters market noise, which simplifies the use of this tool in lower time frames;
- It helps determine the current trend as well as resistance and support;
- It is universal: this indicator is primarily used for trading intraday, and in time frames from M15 to H4. Nevertheless, it is suitable for any strategy;
- It is accurate: the VWAP shows the price of an asset for any time period more objectively than the MA. It is kind of a benchmark for players;
- It is a popular and efficient tool. The Volume Weighted Average Price is used not only by traders but also by institutional investors and various hedge funds;
- It provides the possibility of end-to-end analysis by comparing different time periods;
- It is the basis for building a high-frequency trading strategy;
- Paid versions draw fairly accurate channel lines compared to other indicators.
Disadvantages:
- It can’t forecast an asset’s future movements. This tool reflects only the current situation in the market. So, make sure you use other indicators to predict prices;
- There is a possibility of data corruption in long-term trading;
- There is a possibility of lagging, which increases when the settlement period comes to an end. This reduces the reliability of the forecast made according to the data provided;
- It partially shows only quote history and has strictly defined start and finish points;
- Data relativity. When it comes to volumes on Forex, the tick indicator of a particular broker is taken to calculate the indicator on a free basis.
Therefore, traders usually use the tool for trading on stock exchanges or use its paid versions.
Differences from MA
Let's take a closer look at the differences between the VWAP and the MA. This can help you decide which option to use.
Notably, some traders use both indicators at once. Practice shows that they complement each other well.
Difference between the Moving Average and the Volume Weighted Average Price:
- the VWAP shows data more objectively than the MA as it reflects not only the price but also volumes;
- free versions of the VWAP use tick volumes of specific brokers for calculation. Therefore, they do not illustrate the situation in the market accurately. That is why some traders still prefer the MA;
- the VWAP is very sensitive to the slightest changes in the market. The MA and its varieties do not display minor adjustments on the chart, but they will appear when plotting the Volume Weighted Average Price;
- if moving averages are by and large infinite, the VWAP is calculated for a limited period of time. Discontinuity as well as the presence of open and close points are typical for it;
- both are lagging indicators. However, in the case of the VWAP, lagging becomes more prominent towards the end of a time period, which is due to the accumulation of a large amount of data and volume averaging;
- the VWAP can be applied to a series of charts (daily, weekly, etc.). Analyzing different time frames allows you to assess the market situation properly.
Although the VWAP is similar to the MA, they are still different indicators. Therefore, traders always keep that in mind when applying the tools in trading.
VWAP Formula
Let’s see how the VWAP is calculated.
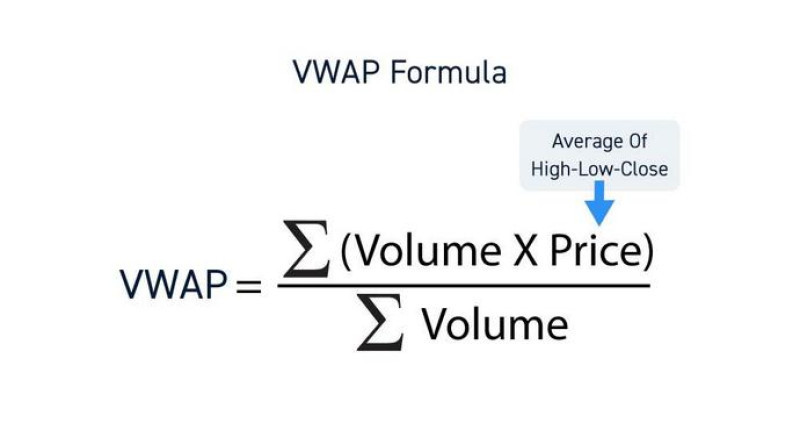
Thus, we take the Typical Price and the corresponding traded Volume for a certain period of time. Speaking of Forex, free versions of the VWAP show the volume as the number of ticks.
These figures are multiplied, and the aggregate figure is reflected in the numerator.
The result is divided by the total trading volume.
Let’s seen an example.
The Typical Price is an indicator that is most often formed by adding the high, the low, and the closing price. The result is divided by 3 or another number, depending on how many price indicators are used.
In some cases, the open price and the close price are used.
The result should be multiplied by the volume for this time period and then divided by the cumulative trading volume.
Subsequent indicators are calculated according to a similar formula, with data being constantly accumulated. Simply put, all new figures are added to the previously calculated.
Notably, the Volume Weighted Average Price formula serves the introductory function here. When used in trading, the VWAP performs calculations itself.
Signals
When using any indicator, make sure you know how to interpret its signals.
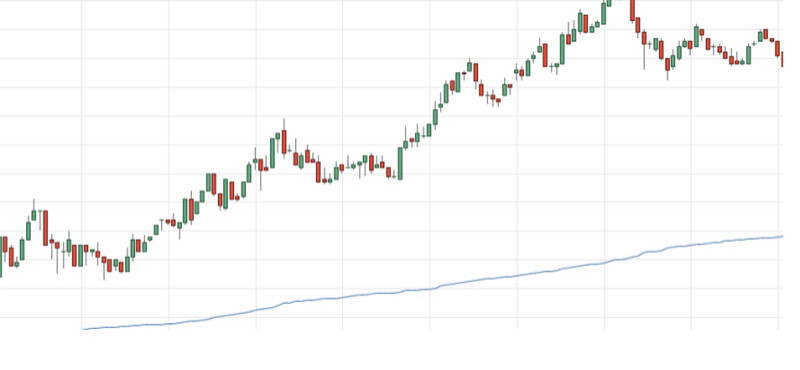
- Mutual arrangement of lines: when the price line is above the VWAP line for a long time, we have a bull trend.
Conversely, when the VWAP line stays above the price line for a long time, it is a bear trend.
Here we talk about a long-term period only. Therefore, you should not jump to any premature conclusions if, for example, such a signal is generated on the daily chart.
Let's take a look at the chart of EUR/USD. The price is highlighted green, and the indicator is colored white.
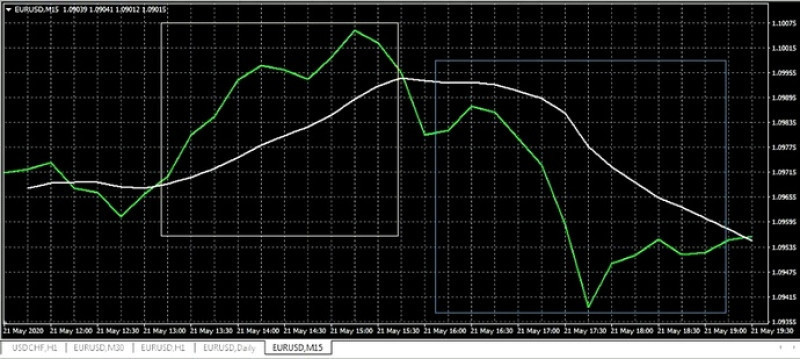
In the gray square, the trend is bullish. In the blue square, the trend is bearish.
However, a reversal occurred between the two trends. It was hard to foresee a reversal using the VWAP only. That is why it is essential that traders also apply other indicators;
- When the price is below the VWAP, it means a currency will be bought at a price that is below the market average price.
Aggressive traders go long when the price moves up while being under the VWAP line. Meanwhile, conservative traders open long positions when the price line crosses the indicator line to the upside.
With short positions, that would be the other way around. For example, when following a traditional strategy, you should go short when the price line crosses the indicator line to the downside;
- Frequent and long-term intersections of the lines indicate a flat market;
- Any deviation of the price from the indicator illustrates that a balance between buyers and sellers is lost. This fact should be taken into account when you consider entering the market;
- When the indicator is headed down, it means demand for a currency falls. In such a case, a sideways trend may begin;
- Analysis of a batch of data from the Volume Weighted Average Price in different time frames is able to predict a reversal.
Let’s assume a trader uses the daily Volume Weighted Average Price. In order not to miss signs of an impending reversal, the weekly Volume Weighted Average Price should be used as well.
When the daily VWAP is above the weekly VWAP and the quote is above the daily VWAP, it is a bull trend. However, if the quote breaks through the daily VWAP and then through the weekly VWAP, it usually shows an impending reversal.
This is when it is wiser to close buy trades and/or open sell trades.
There is another reversal signal, which is generated when there are multiple downside intersections of the price with the indicator.
This is when demand for an instrument falls and the current trend grows weaker.
At the same time, it is important to remember that when applying various strategies – trend or counter-trend – some signals are also interpreted differently.
Where to find VWAP indicator and how to install it
The Volume Weighted Average Price is not available for the common MetaTrader tool kit. Therefore, if you want to use it, you should find and download it.
Depending on the functionality, there are paid and free versions of the indicator. Both can be downloaded through MetaTrader Market.
You can buy the paid version using the MQL5 account of other payment systems.
If you purchase the VWAP through MetaTrader Market, it will be available for the trading platform immediately after downloading. In addition, before the download, you will get a detailed description, screenshots, and a demo version of the indicator.
When downloading is over, the tool will appear in the Data Catalog.
It can also be downloaded from open sources. In this case, the following steps should be made:
- Download the indicator to your device and unpack the archive. The files will have the ex4/ex5 or mq4/mq5 extension.
- Open the trading platform and select the Data Catalog tab in the File section.
- Copy unzipped files to the clipboard.
- Go to the MQL4/MQL5 - Indicators folder and paste the files from the clipboard into it.
- Restart MetaTrader.
Important! Before using the tool, you should allow DLL import to the platform. Otherwise, it will not function.
When the VWAP is added to the platform, it should then be attached to the chart.
This could be done in several ways:
- In the main menu of the platform, click Insert → Indicators → VWAP;
- Select the Charts section on the toolbar and press the "+" button;
- Use the Navigator window by clicking the Attach to Chart button or by dragging and dropping it directly onto the chart.
The indicator can be removed from the chart if needed.
How to check data validity
Each trader should understand that any indicator is effective only if the data it processes and shows is valid. Therefore, if you download the tool from open sources, you should check whether it really calculates the Volume Weighted Average Price.
You can do this using Excel spreadsheets:
- Find Quotes Archive on the platform you are using and specify the asset and the time frame;
- Export and save these data in CSV text format. Each row in the file is a table row. Columns are separated from each other by commas or other characters;
- Open an Excel document. Dates will be displayed in the first column and volumes will be shown in the last column. Quotes will be reflected in the columns in between;
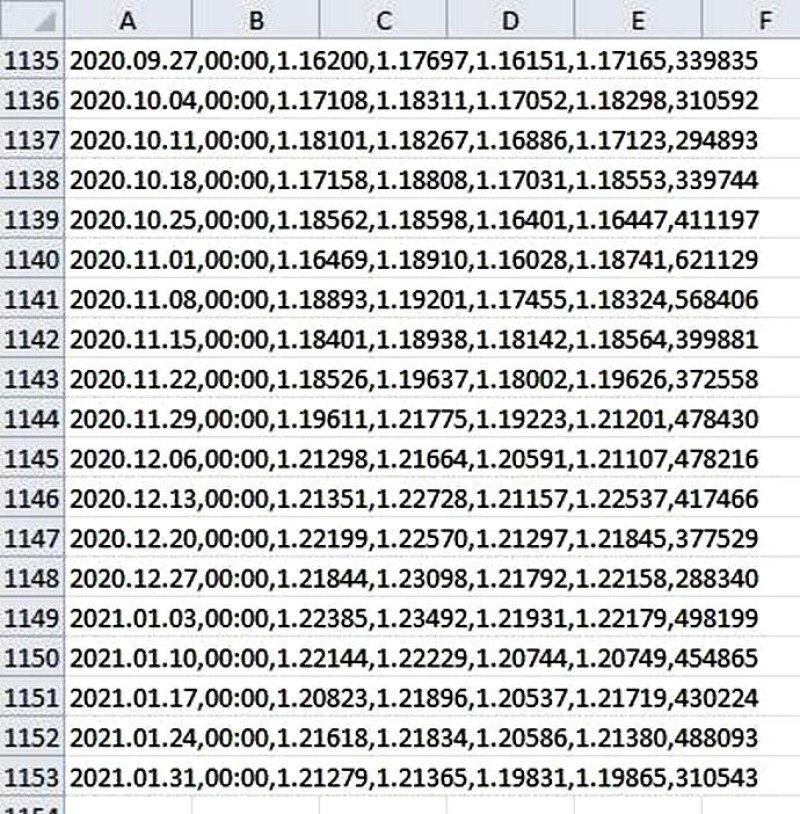
- Extract the desired data using the function LEFT SYMBOL / RIGHT SYMBOL. Important! Here not all the available data about quotes will be needed;
- When all the data is in its place in the table, you should calculate the final results using the Formulas tab.
In the next free columns, you can place the data from the numerator part of the VWAP formula and the final data for a specific period of time;
It remains only to compare the result of your own calculations with those given by the indicator. Still, it is important to remember that time intervals should be the same in both cases.
VWAP: trading
When trading with the Volume Weighted Average Price, you should remember that it is more efficient when used with other indicators.
These can be the Stochastic Oscillator and impulse tools, for example.
It can help traders to determine:
- Resistance and Support: when quotes are above the indicator line, it is support. Consequently, when the price is below the line, it is resistance;
- trends: depending on where the indicator line is currently heading, it is able to show price changes.
So, if quotes are above the indicator line for a long time, the trend is usually bullish. When the price is below the line, it is a bearish trend. However, it helps find only long-term trends, and its signals should also be confirmed by other indicators.
You should also remember that trends reverse. So, how can we know when it is going to happen?
This is when we should turn to professional advice.
Thus, when the price breaks through the daily and weekly Volume Weighted Average Price, you should halt trading with the trend even if quotes continue moving in the same direction.
The price will highly likely reverse or move sideways soon, which means you should take another trading approach.
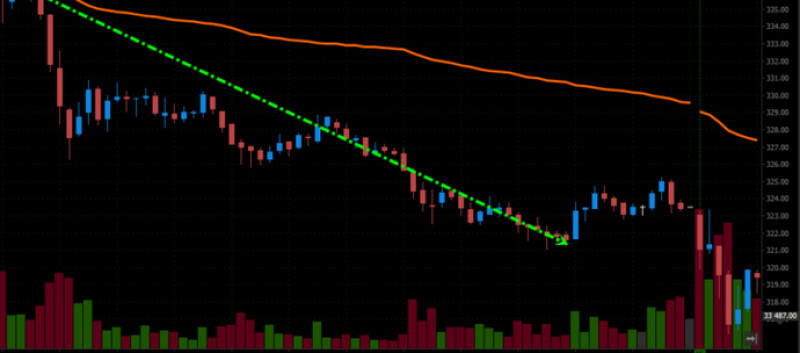
There is another potential sign of an upcoming reversal. It is a breakout through the daily Volume Weighted Average Price for several days against the weekly trend.
For instance, EUR/USD was bullish during the week. The price broke through the daily Volume Weighted Average Price for three days, and a steep drop in its value followed.
In such a case, there is a low probability of a bullish continuation;
- open and close prices: we have already mentioned that the indicator can detect several lines, of which only one is the main.
The upper and lower lines can be used to indicate overbought and oversold zones. When the main line crosses the upper one, a currency can be sold. Conversely, when the main line crosses the lower line, a currency can be bought.
At the same time, this situation may portend an upcoming reversal, so additional signals from other indicators are needed.
Trading with trend and against it
The VWAP is suitable for implementing many strategies. However, despite the diversity, it can be divided into two large groups: trend and countertrend.
In the first case, you trade with the trend, that is, you buy a currency when the price is below the indicator line or crosses it to the downside, and sell it when the price crosses the indicator line to the upside.
In this case, trading is based on distancing from the VWAP line.
In the second case, you trade against the trend. That is, the algorithm of your actions is completely opposite. Here trading is already based on approaching the VWAP line.
It is generally accepted that the first option is the most common among market participants. However, it does not mean we should immediately draw a categorical conclusion.
For example, some professionals alternate them depending on the market situation.
Given that the indicator starts to lag more by the end of a time period, you should trade with the trend at the beginning of the selected period and against it by its end.
In both cases, there are rules that you should follow when trading with the VWAP.
When trading against the trend, make sure you:
- compare the current weekly and daily indicators with the previous ones for the same periods before you compare the daily indicator with the weekly one;
- trade against the trend in the current session if the previous time section ended with the fourth, fifth, or sixth deviation;
- open a position for two, three, or four deviations in the current time period.
When trading with the trend, you should:
- compare indicators based on the rules of counter-trend trading;
- make sure that the price consolidates above or below the VWAP line. When you notice such a tendency from the very start of a time period, this indicates either bullish or bearish power;
- Ideally, the VWAP should settle with a difference of two deviations from the previous period;
- place Take Profit on the eighth deviation and Stop Loss on the VWAP line.
Who can use VWAP
The indicator is popular among various categories of market participants. Let’s find out who they are and what problems they can solve using the VWAP.
- For whales, or large players, the Volume Weighted Average Price reflects the equilibrium in the market.
So, when the price deviates from the indicator, it means the time for lucrative trades has come. This is when the price is especially attractive.
Savvy traders open long positions when the Volume Weighted Average Price is above the price. The greater the distance between them, the more active the traders.
Conversely, when the VWAP is below the price, long positions are closed, and sell positions are opened.
There is a simple explanation: it is wiser to invest substantial amounts in an asset at a price lower than the VWAP and sell it when the price is higher than the VWAP;
- Retail traders mostly use the indicator to find resistance and support.
The tool also helps identify the open and close points of trends; - Those who prefer high-frequency trading use the VWAP to open trades at relatively neutral points that are not marked by sharp jumps in price;
- Prop trading firms use the tool to evaluate the efficacy of a particular instrument. The VWAP is also used by pension funds and government agencies, etc.
Settings
The VWAP is a user-friendly indicator. Nevertheless, it is commonly applied not only by beginners but also by experienced traders and institutional investors.
In each case, it solves the problems set by a particular user.
It requires little time and effort to add the VWAP to the platform.
The VWAP settings window comprises several sections:
- Common
- Input Data
- Colors and Display
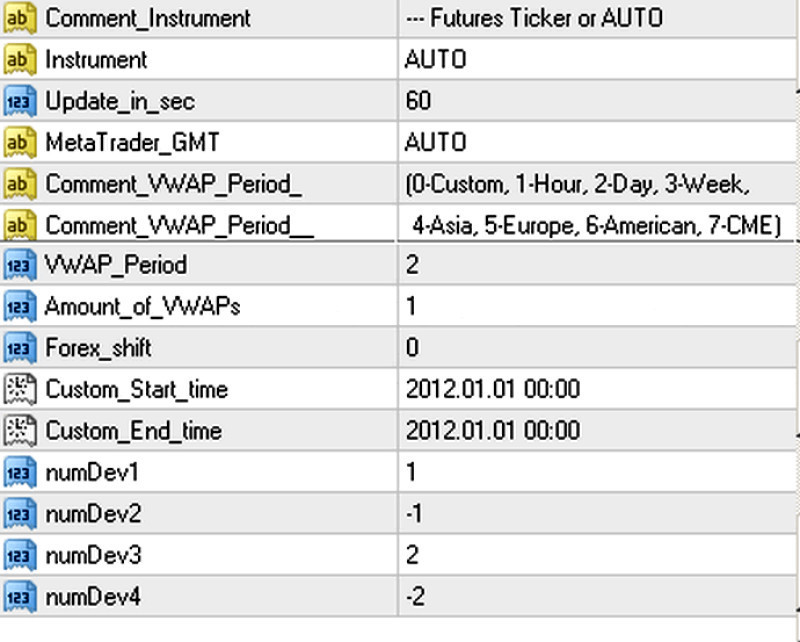
The second section is the most important one. It is illustrated in the screenshot above.
1. Instrument is the name of an asset that the trader plans to work with. It can be a futures ticker, a security ticker, or a currency pair ticker. If you do not enter specific data in the next line, the mode will be automatic;
2. Update in sec. Here you need to specify the update frequency in seconds. For example, you enter 60 seconds when an update is needed once a minute or 300 seconds when you want to receive fresh data every five minutes;
3. MetaTrader GMT. Here you need to specify the time zone of your trading platform. If you save the automatic option, the time zone will be determined automatically;
4. VWAP Period is the period of time that will be used for calculations. For example, you can choose an hour, a week, or a specific session;
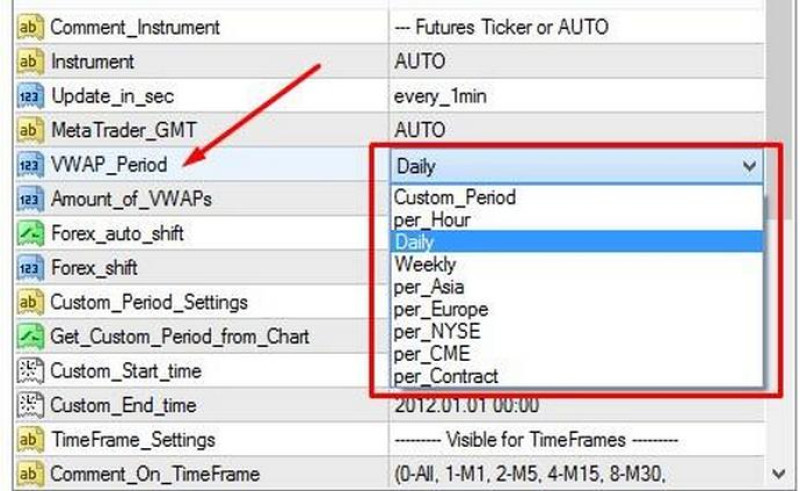
5. Amount of VWAPs. Here you can set the number of charts as there can be more than one;
6. Forex Shift. Here you specify the number of pips by which the chart will shift. This variable may be greater than or less than zero;
7. Custom Start time/End time. Here the trader enters the start and finish time of the time interval for which the VWAP will be built.
Other settings sections – Common, and Colours and Display – are simple even for beginners. Generally speaking, these settings allow traders to select the design and basic functions of charts.
The above-described settings are common for the paid version of the indicator. Meanwhile, the free version for MT4 allows you to enter just the period and shift options and add a few more options for MT5.
VWAP indicator strategies
Let’s look at some VWAP trading strategies to see how the indicator works. No matter the strategy, you should take into account the version of the Volume Weighted Average Price.
Of all the free options, the MetaTrader 5 version is closer to the full version, which allows you to use channel techniques.
Example 1
When following this strategy, you should use two time frames – Daily and H1.
The strategy has the following features:
- entry signals are made no more than once or twice in two weeks;
- trading is conducted within one day;
- open positions are held for about two days;
- each position brings a profit of about 40 pips;
- Some 90% of trades are profitable. Still, it is a modest profit.
Any currency pair can be used for trading. Let’s take the most commonly traded pair, EUR/USD with Period 11 and Forex Shift 0.
Requirements for opening positions:
- the price should change direction in the daily time frame, and the signal candlestick should close above or below the indicator line. When the price is above the VWAP, you should sell. When the price is below the VWAP, you should buy;
- the price should change direction in the hourly time frame and the signal candlestick should close above or below VWAP.
In this case, trades could be opened at the level of the candlestick that follows the signal candlestick, and Stop Loss should be placed at a distance of about 25 pips.
When the profit margin reaches 20 pips, Stop Loss should be moved to the open point.
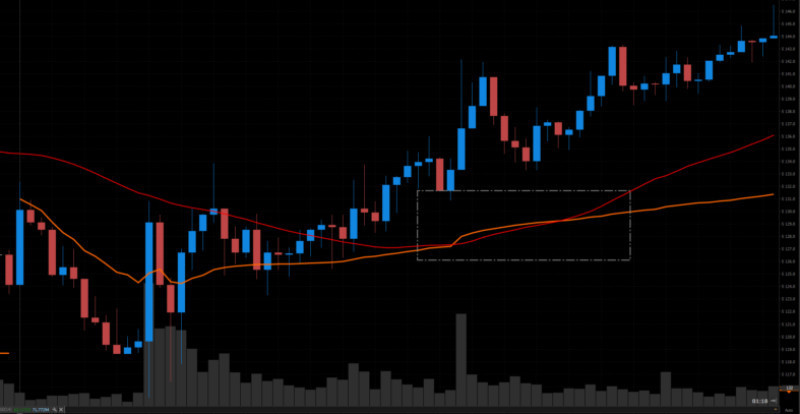
Let’s look at the screenshot to get a picture of how this strategy works.
In the screenshot, we have the daily chart of EUR/USD with two signals on different days. This means that in order to open positions, you should find similar signals on the H1 chart.
Keep in mind that these should be days following those with signals on the daily chart.
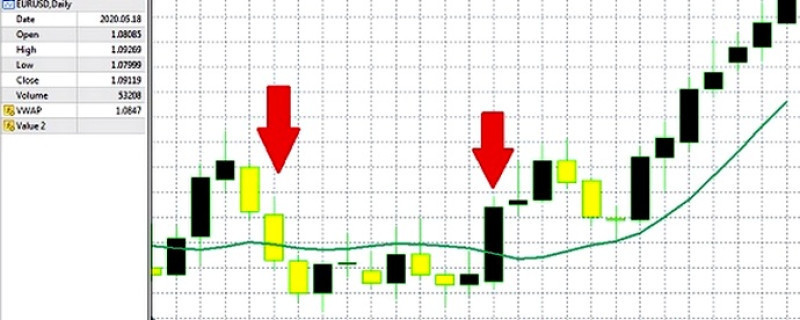
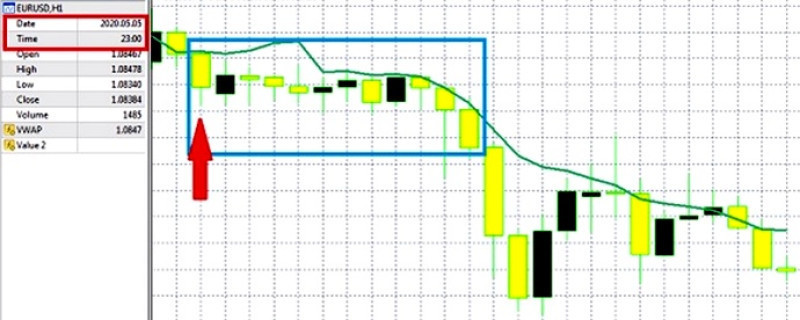
First, we check the earlier signal. The chart shows that the signal candlestick closes below the VWAP, meaning a trade could be opened at the level of the very first candlestick on the H1 chart.
Even if a trade is opened a little later (within the blue rectangle), it will still bring profit.
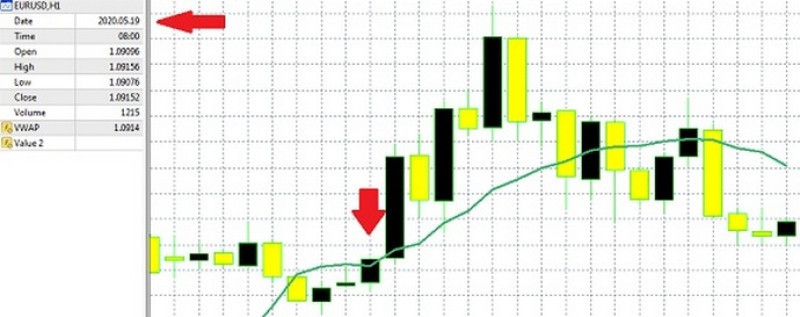
Next, we check the second signal in the same way.
In this case, the signal candlestick only touches the VWAP, but you definitely could open a position at the level of the next candlestick.
This example shows that a trader still plays a rather important role despite general requirements for opening positions with the help of VWAP. After all, knowing the market situation, they can make adjustments to the trading strategy by opening a trade and bending the rigid rules slightly.
Example 2
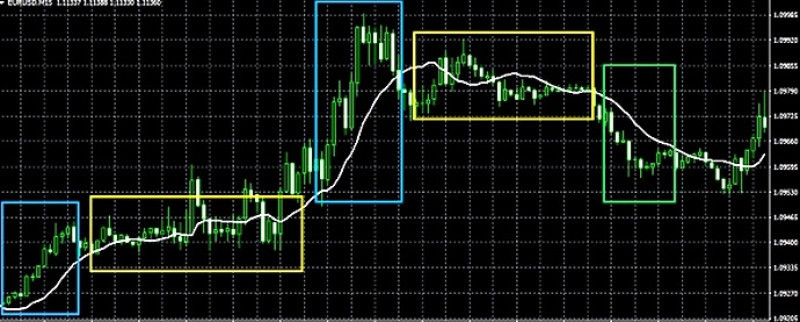
The VWAP and the MA are used together with Period 20. The traded asset will be EUR/USD in the M5 timeframe.
Of all the varieties of moving averages, we use the SMA to reduce the lagging.
Trading will be according to the following rules:
- Long positions are opened when the SMA crosses the VWAP and the signal candlestick closes above them. The first line should intersect the second one to the upside;
- Short positions are opened when the signal candlestick is below the indicators’ line. In addition, the SMA should cross the VWAP to the downside.
Some of them will be the main signals and others will be preliminary ones.
The main signals will be made when the price crosses the SMA and the VWAP. The preliminary signals will be generated when the SMA and the VWAP intersect.
What is more, the candlestick should be above or below the lines of both indicators.

Let’s look at the chart and see what the highlighted points mean:
- The price breaks through the SMA and the VWAP. The indicators are not crossed but are heading down.
Open is an entry point. In this case, it is a sell entry point. - There are no prerequisites for trading. The bearish momentum is probably wearing off;
- There are all the necessary conditions for buying: the candlestick closes above the indicators, the SMA crosses the VWAP to the upside;
- In this case, we should expect a stronger upward trend as the bears are getting weaker;
- The price is above the SMA and the VWAP. It would be unwise to open trades;
- Same as for point 5;
- There is a small chance of a reversal. Therefore, we should wait for a while to see whether the signal will be confirmed or not;
- Trades could be closed because a short candlestick indicates an impending reversal;
- Trades could also be closed because of a bullish candlestick that is engulfing the previous bearish candlestick.
Example 3
In this case, we will use the VWAP with the Price Action strategy. The essence of this method is that the trader analyzes the chart based on the shape, size, and combination of bars, or candlesticks. Oftentimes, it is about candlestick patterns.
The VWAP is of secondary importance here. It is used only to confirm or deny signals that come from the detected patterns.
On the chart, we find Resistance, Support, and Fibonacci levels. At the same time, we try to detect candlestick patterns.
Then, we monitor the market to catch the breakout points of the above-mentioned levels. To exclude or confirm a correction, we use the VWAP.
A breakout occurs in the following cases:
- when the price breaks the VWAP at the same time;
- when the candlestick closes above/below the indicator depending on which direction is chosen to open a position.
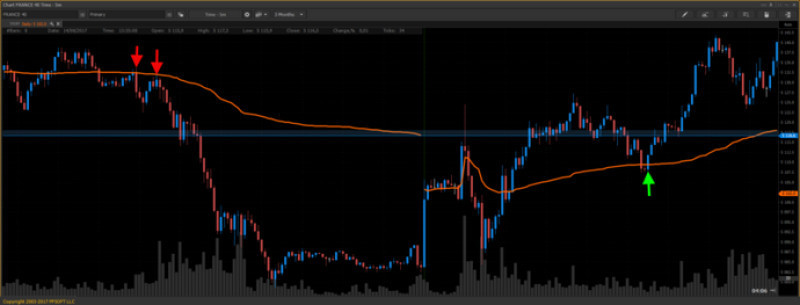
Let’s look at the chart of EUR/USD with the H1 time frame and Period 12.
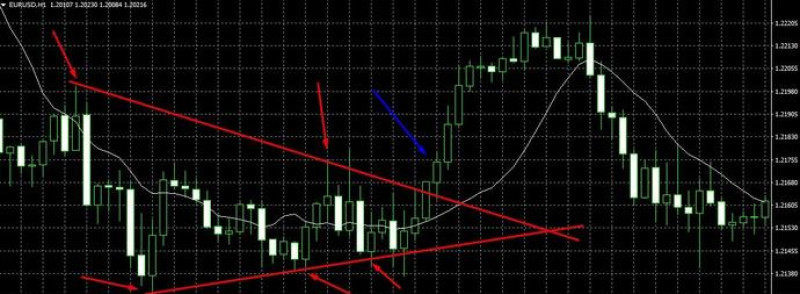
The price hovers around the indicator line, indicating a sideways trend.
Using the high and the low we can build a Triangle. In the screenshot, it is highlighted with red lines as well as red arrows showing the extreme points.
The blue arrow is a point where the previous candlestick breaks through one of the Triangle’s sides. At the moment of closing, it is located above the VWAP, which is colored white.
The VWAP heads down, which means buy trades could be opened at the level of the next candlestick.
The trader decides when to close a position. For instance, that could be done at the level of the Doji candlestick, following the rules of graphic patterns.
These three examples show how the VWAP can be applied in trading. However, there are even more ways of using this indicator.
Traders can develop their own VWAP trading strategies and test them in a demo account or Cent account to avoid losses.
How to use VWAP
You can’t forecast price movements using the VWAP alone as it only provides data about an asset for the past periods.
Therefore, make sure you use additional tools to confirm or deny signals.
- VWAP does not recognize patterns that were in the reporting periods. It only provides statistical data. Although it is a trend indicator, you will hardly forecast future price movements with it;
- VWAP can be used to determine support and resistance when the market is in a trend. When the price is below the indicator, buy trades could be opened. Otherwise, they are considered expensive.
When there is a bullish trend, the Volume Weighted Average Price can be seen as a support zone. Conversely, when it is a bearish trend, the indicator is seen as a resistance zone;
- this tool is the most efficient in the daily time frame. In addition, it would be wiser not to use the M1 time frame;
- its efficacy depends on how volatile an asset is. It is best when this figure is average;
- during periods of important events in the economic calendar, when market activity increases, you should avoid using this tool;
- if quotes have been around the indicator line for a long time, it illustrates the balance of value, supply, and demand, which is usually followed by a reversal;
- another important thing is that there are many versions of the indicator. They can be free with limited features and paid with access to more objective statistics.
In fact, they all have only one feature in common - the VWAP formula. However, the numbers used are different.
To minimize the negative effects of these differences, you can:
- read the instructions as to how to use the downloaded version of the VWAP in order to see what data you have to work with. If this is a free version, the volume will indicate the number of ticks for the selected period of time and most often with a particular broker.
Although there is little in common with the classic volume in this case, the tick volume still illustrates the demand for a particular asset; - test the selected VWAP on small-size trades with low risks or a demo account.
This will help you better understand its signals and see whether it is suitable for your trading strategy; - see how the indicator works and develop your own VWAP trading strategy.
Final thoughts
This article is about an indispensable tool for any trader regardless of their experiences and capital size. This indicator is similar to the MA. However, the calculation formula shows that there are significant differences between them.
The fact that the VWAP indicator also uses volume data makes it a more accurate indicator, especially when it comes to more advanced paid versions.
This article also covers how the VWAP and the MA can work together.
Read more
Bollinger Bands: strategy and way of use
MFI Indicator (Money Flow Index): complete guide
Awesome Oscillator: how to use
Support and Resistance Indicator MT4, MT5
MT4 indicators: how to install and use
Candlestick patterns Indicator for MT4, MT5
Forex volume indicators for MT4, MT5
Forex arrow indicators for MT4


