


This article is about the most popular and efficient MT4 indicators. If you want to dive deeper into this topic, you can read the article “Most efficient forex indicators for trading.”
This article focuses on MT4 indicators, their types, and usage.
What are MT4 indicators for?
In order to achieve success on Forex, being lucky is not enough. Making accurate forecasts is the key to profitable FX trading.
This allows you to open and close trades in the right direction at the right moment.
Still, market forecasts have nothing to do with gambling. When it comes to gambling, the outcome depends solely on Lady Luck. Meanwhile, in trading, your profitability relies on the accuracy of market forecasts.
Technical analysis is the most common type of analysis, where traders use quote history to predict future price movements.
Assets move in cycles. That is, a price movement is likely to repeat again under the same circumstances.
You can either search for patterns on the chart yourself or use indicators to do this for you. In the latter case, a tool will “scan” past quotes and show you possible future movements.
Trading platforms usually provide traders with technical indicators.
Each tool has its own function. Here is the list of technical indicator types:
- Trend indicators: in this case the name speaks for itself. These are tools showing price movements and the strength of a bull/bear trend.
- Channel indicators: these tools are based on drawing price corridors limited by support and resistance on the chart.
- Oscillator indicators: these tools identify trend reversals. They are only efficient when there is no clear trend on the chart.
- Volatility indicators: they measure changes in the strength and volume of the price.
- Volume indicators: these tools reflect price changes of assets over a time period. On Forex, volume is about the number of ticks, and not about the number of trades.
MT4 indicators
MetaTrader 4, the most popular trading platform, has 30 built-in technical indicators. That is, they are pre-installed tools that only require activation.
Here are the types of MT4 indicators:
- trend indicators
- oscillator indicators
- volume indicators
- Bill Williams indicators
In addition, MT4 allows users to create their own tools or download and install custom indicators from the Internet.
Custom indicators can be designed by professional traders, programmers, or brokers. For instance, InstaForex has a vast array of such tools for MT4.
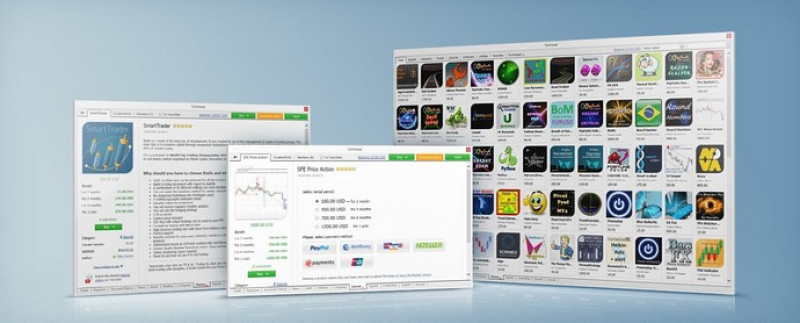
Above all else, you can buy, lease, or install free indicators from MetaTrader Market, an online store of free and paid trading robots and technical indicators.
Still, custom tools do not have all the features of default indicators. Therefore, let’s look at popular built-in MT4 indicators first.
1. Moving average convergence divergence (MACD) is a trend-following momentum oscillator that shows the relationship between two moving averages of a price.
It is considered one of the simplest, most versatile, and most reliable technical indicators.
The MACD is calculated by subtracting the 26-period exponential moving average (EMA) from the 12-period EMA.
The MACD is often displayed with a histogram and lines.
There is also a signal line, which is a 9-day EMA of the MACD line.
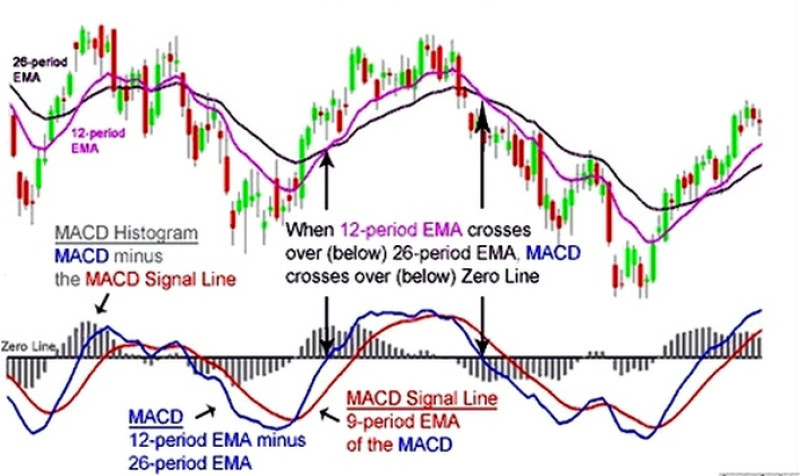
To spot a buy or sell signal with this indicator, you need to identify an intersection of the MACD line with the signal line. When the MACD line falls across the signal line, it is considered a sell signal. Conversely, when the MACD line rises across the signal line, we have a buy signal.
However, the MACD is mostly used to find divergences. So, when the price reaches a new extreme level and the MACD does not, a trend gets weaker.
This means a reversal is impending.
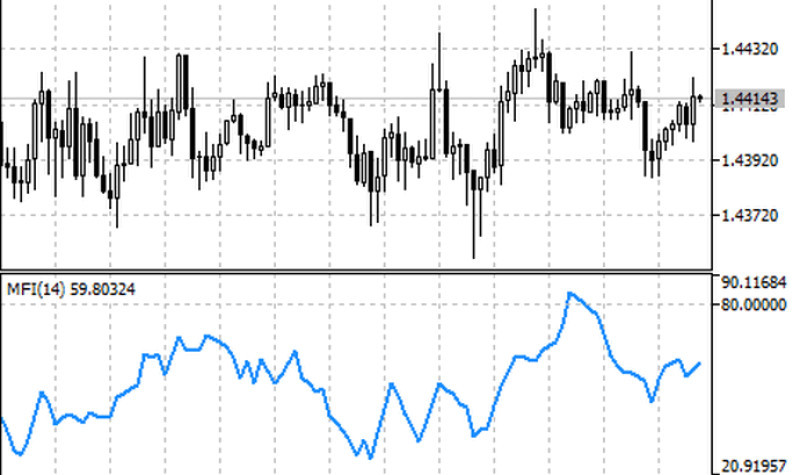
2. The Money Flow Index is a volume indicator based on the rate at which money is going in and out of a security.
The indicator moves in the range between 0 and 100, with oversold and overbought readings of 20 and 80 respectively.
The tool measures buying and selling pressure.
MFI signals on MT4:
- the overbought condition occurs when the MFI rises above 80, which is bad timing for buying.
- the MFI below 20 indicates an oversold condition, which is bad timing for selling.
- when the indicator and the price shown mixed movement, a reversal is impending.
3. The Stochastic Oscillator is a momentum indicator comparing a particular closing price of a security to a range of its prices over a certain period of time.
It is represented as a solid line and a dotted line: one reflecting the actual value of the oscillator and the other reflecting its moving average.
Important readings are also 20 and 80.
How it looks on МТ4 chart:
- When one of the lines breaks above 20, you can buy;
- When the lines cross 80 to the upside, it is time to sell;
- When the solid line crosses the dotted line to the downside, an asset could be bought;
- When the solid line crosses the dotted line to the upside, an asset should be sold.
4. The Relative Strength Index (RSI) is a technical indicator measuring the strength or weakness of an asset by comparing its gains versus its losses over a time period.
The indicator swings in the range between 0 and 100.
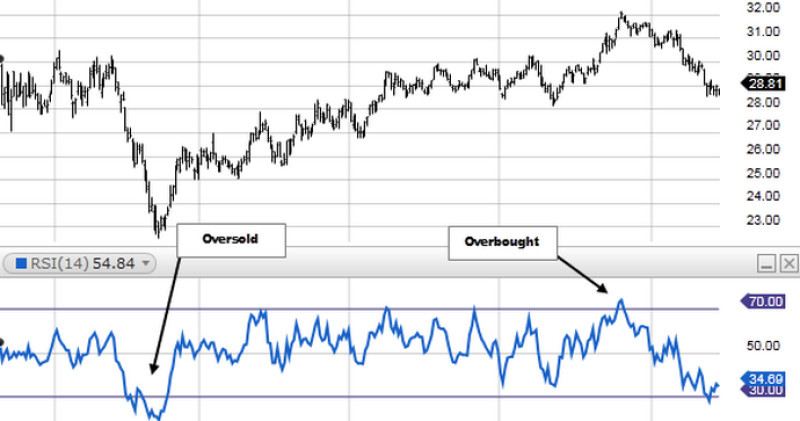
The RSI is mainly used to identify divergences. For instance, a reversal is likely when the price reaches a new high, and the index does not.
This indicates that the new high has been hit mainly due to a limited number of sellers and not an increase in the number of buyers. So, the price is slowing its growth.
In a situation like that, it would be wiser not to open new buy trades and close the existing ones.
In addition, the Relative Strength Index is used for trend trading to determine overbought and oversold conditions.
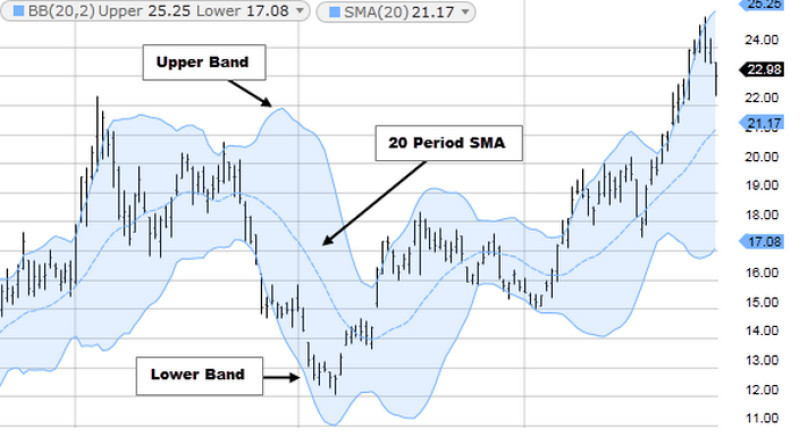
5. Bollinger Bands are a volatility indicator, which is based on a standard deviation of an asset from the SMA.
The indicator is represented as three bands: upper, lower, and middle. The upper band shows the highest price against the SMA, the lower band reflects the lowest price against the SMA, and the middle band is the SMA itself.
The corridor widens when volatility rises and narrows when it falls.
When the price heads to the lower band, an asset is considered oversold. It is time to go long because the uptrend is about to start.
When quotes touch the upper band, the pair is overbought, so it is time to sell an asset.
It is important to understand that there is no guarantee that a reversal will occur whenever one of the bands is reached. Other indicators should be used to confirm a reversal signal.
How to add indicator on MT4 to chart
We have listed only commonly used MT4 indicators. Still, traders must know that not all tools need to be applied.
Firstly, when you use too many indicators, it can be distracting. Secondly, many of them perform the same function, so the use of multiple tools makes no sense.
Therefore, most traders apply a limited number of those 30 indicators offered by MT4. They should be saved in Favorites for quicker access.
When you select indicators, you should add them to the chart because this cannot be done automatically.
To add an indicator on the chart, you should do the following:
1. Select the appropriate command in the main menu of MT4: select Indicators and specify their type (trend, volume, and so on) on the drop-down list of the Insert section.
Find and click the required option on the list.
2. Click the “+” button in the Charts section of the MT4 toolbar and choose one of the options on the list.
3. Open the Navigator window, find and click the required indicator in the "Indicators" section of MT4. Click Attach to chart on a drop-down list.
4. Use Drag'n'Drop and drag the indicator from the Navigator window to the currency chart or to the window of another indicator.
MT4 information indicators
This is a separate group of indicators that serve the informative function. They inform users about important aspects of the market situation. This, in turn, makes trading easier and more efficient.
Information indicators do not generate clear trading signals. They will not tell you when to buy/sell a currency or to put trading on hold.
They can only identify general trends in the current market situation.
For instance, information indicators can show the current trend or how far quotes are from the overbought/oversold zone. A trader assesses such data and decides what to do next.
The choice of MT4 information indicators does not depend on your trading strategy. They are suitable for scalpers as well as long-term traders.
Here are the main types of MT4 information indicators:
- Time indicators
Time is our most valuable resource. On Forex, time is even of great importance and every moment counts here.
These indicators help traders use time rationally when trading. They count the remaining time before a candlestick or a session closes.
Why is it important? Because volatility can change depending on time.
Examples of indicators showing the close of a candlestick:
- Candle Time: it is the easiest indicator that does not require to be set. The corresponding time can be seen on the price chart.
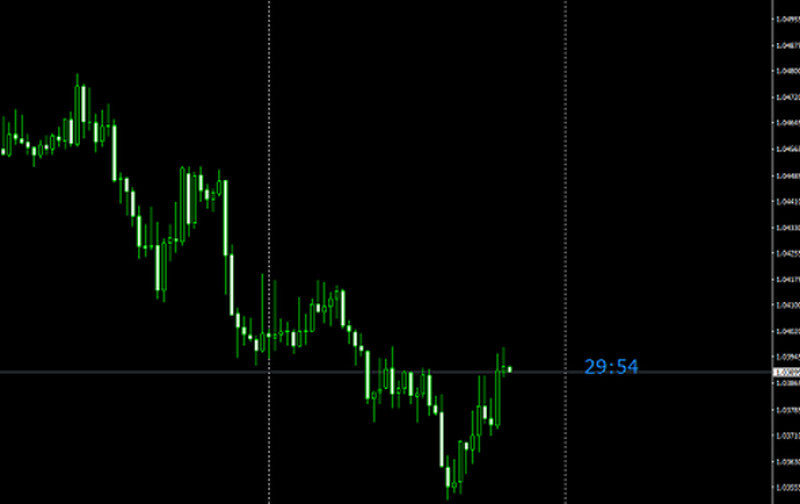
- Candle Countdown: it is similar to Candle Time but allows you to change the color, size, and location of digits on the chart as well as the background.
- Candle: it is almost a complete analog of Candle Countdown.
These indicators are of invaluable help to short-term traders (M1, M5) because the closing time of a candlestick is of crucial importance in this case.
There are also many indicators showing the closing time of a trading session, with i-Sessions being the most popular of them all.
It is represented by multi-colored rectangles on the chart. Each rectangle corresponds to a specific session.
It is commonly known that trading on Forex is 24/5. Every day, trading gradually moves from one corner of the globe to another.
Each session has its features. Therefore, certain trading strategies focus on specific sessions. Meanwhile, traders should monitor how trading sessions go.
- News indicators
News is another crucial factor influencing market sentiment and prices. That is why all traders should track events contained in the economic calendar.
Special indicators, like FFCal, follow macro events.
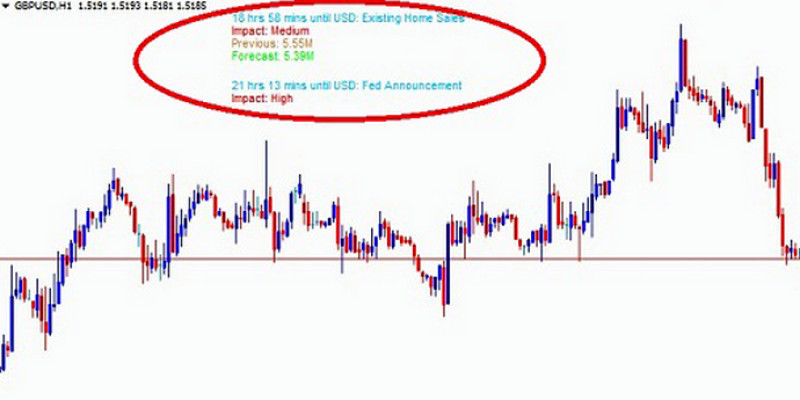
This indicator has various versions, and a lot of other tools are based on its features.
FFCal usually reflects two events from the economic calendar on the chart. They have different colors in order of importance and are equipped with a time counter displaying a countdown to an event.
NewsInfo and Urdala_News are other news indicators.
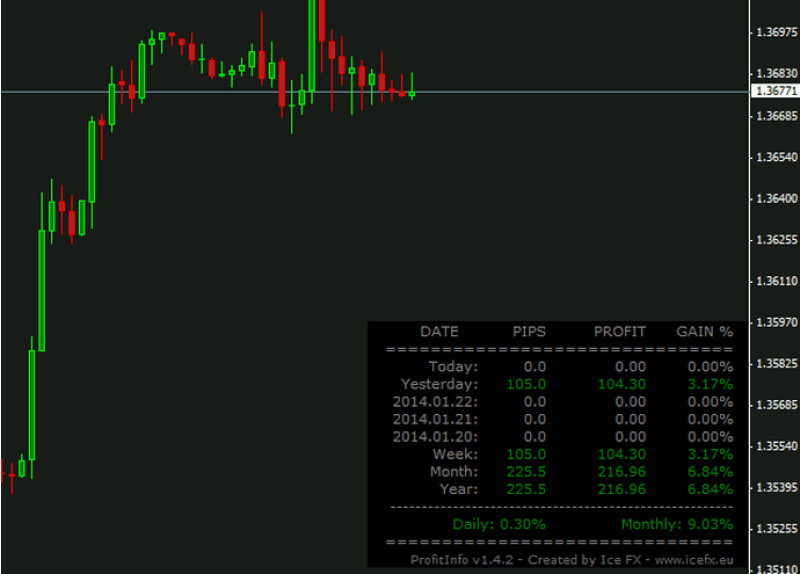
- Profit indicators
Knowing general information about the market is not everything. Every pro and beginner should also be aware of the details such as trading results, the profit size, and so on.
Trading statistics can take a lot of time to be analyzed. In this case, the indicator plays the role of a secretary making all the calculations.
i-Profit is the most commonly used profit indicator with a lot of analogs. It can be applied when trading any currency pair in any time frame.
It shows profits and losses as a percentage or in currency over a time period (daily, weekly, monthly, etc.).
Equity and ProfitInfo are other widely-used profit indicators.
- The Lot Calculator and the Risk Calculator are tools based on risk management principles. They help protect traders from unwanted decisions, where the risk of losing funds is higher than the potential profit.
Mostly, these tools show the optimal trade size in lots, which helps to reduce risks.
Let’s take the Lot Calculator. A user sets a stop-loss order and determines the risk limit per trade (in %).
The indicator will reflect the trade size in lots and calculate the value of 1 pip as well as potential profits and losses.
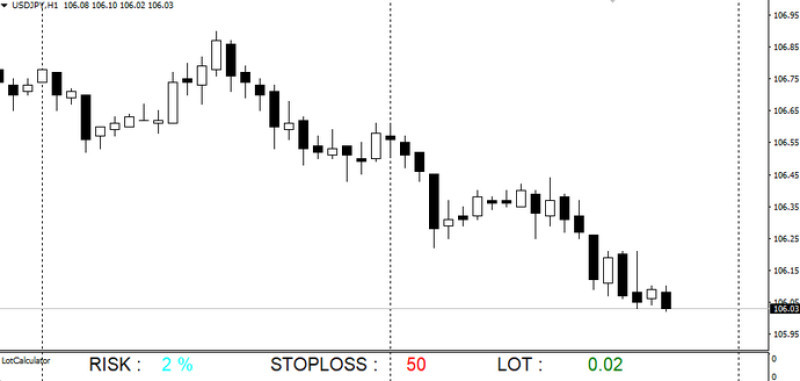
MaxLot and Lot Calc also belong to this group of MT4 indicators.
We have outlined just a small group of MT4 information indicators. There are also swap and spread indicators, candlesticks of higher time frames, and so on.
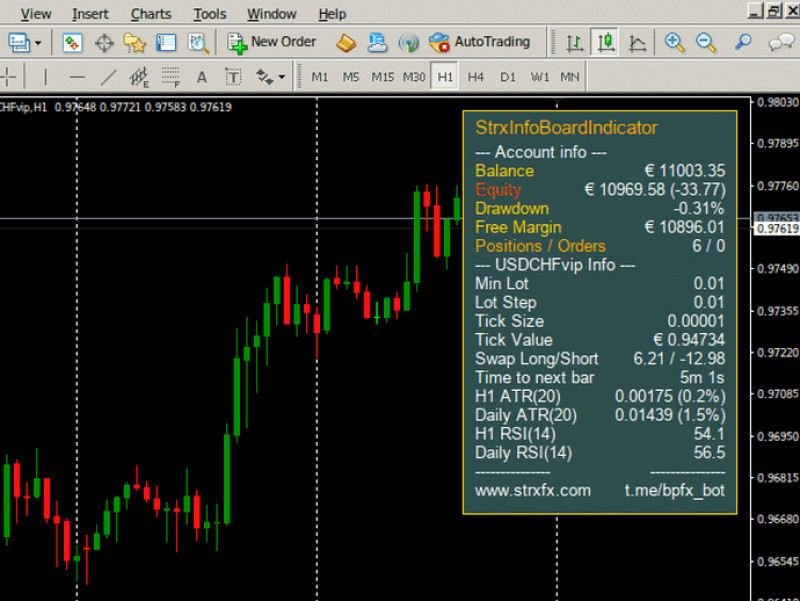
Users who do not wish to download plenty of indicators on MT4 can use the so-called info panels. These products combine the main features of MT4 information tools.
Among the most commonly used info panels are InfoPanel, Stat Informer, etc.
How to install indicators on МТ4
Although MetaTrader 4 offers a set of its own tools, users can also apply external indicators. In fact, they are installed quickly and easily.
1. Downloading: links, as a rule, are in the public domain on the Internet. Some indicators can be downloaded from brokerage websites.
In the latter case, it is mainly about custom indicators.
2. Unpacking: if everything is done correctly, you will get files of an ex4 or mql4 type.
3. Launching: go to the data directory in the File section of the trading platform;
4. MQL4 - Indicators: paste the unzipped document, previously copied to the clipboard;
5. Restarting MT4: an indicator will become available in the Custom section on the indicators list. In order to launch the tool, find its name and click it.
When the indicator is launched, it can be customized.
Importantly, a tool can be deactivated or its settings can be changed in the process of trading. Should it prove ineffective, an indicator can be deleted.
Support and Resistance for MT4
This is one of the most significant indicator groups on Forex, and here is why:
Oftentimes, a trader opens a position based on a signal made by an indicator and suffers losses instead of yielding a profit. This is due to the fact that quotes have reversed.
This is why support (lower limit) and resistance (upper limit) are used as they can help avoid financial losses.
They are psychological levels the price tries but cannot break. In fact, the strength of the barrier depends on the number of breakout attempts.
Support and resistance trading is based on the following principles:
- buy trades are opened when the price hits resistance and sell trades are opened when it touches support;
- savvy traders say the above-mentioned rule works even if the price fails to reach one of the barriers by 1-5 pips. A trade still can be opened;
- optimal distance from a stop-loss order to the barrier is about 30 pips.
When determined correctly, support and resistance make forex trading more efficient.
Some built-in MT4 indicators can help find these levels.
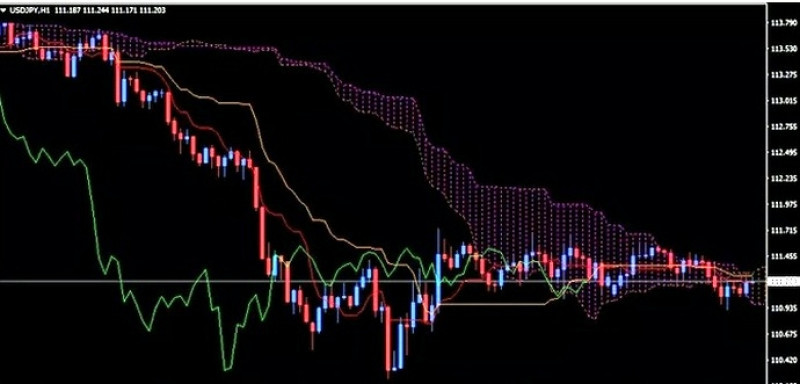
Ichimoku Kinko Hyo is one of them.
It is based on four time frames, represented as a separate line on the chart.
Put concisely, two of these lines – Senkou Span – form a cloud. This zone is usually marked with a different color or shaded.
When the price is within the cloud, there is no trend in the market. Support and resistance in this case are the limits of the cloud.
When quotes are above the cloud, the limits of the cloud are considered to be support 1 and support 2. Meanwhile, when the price is below the zone, the limits are considered to be resistance 1 and resistance 2.
Still, there are custom indicators used for identifying support and resistance, including Zone, Fibo Machine Pro, ACD, etc.
In this article, we have already outlined how they can be installed on MT4.
New indicators on MT4: where to find
All traders in the forex market use indicators in trading. This is usually a set of the most suitable and effective tools.
Experienced traders know that the list of indicators, including for MT4, is constantly expanding. Therefore, if you are aiming to make trading more modern, you should pay attention to them.
Here is how you can learn about new indicators:
- on forums and from publications;
- while browsing for information about trading on the Internet;
- from your fellow traders;
- from brokers, etc.
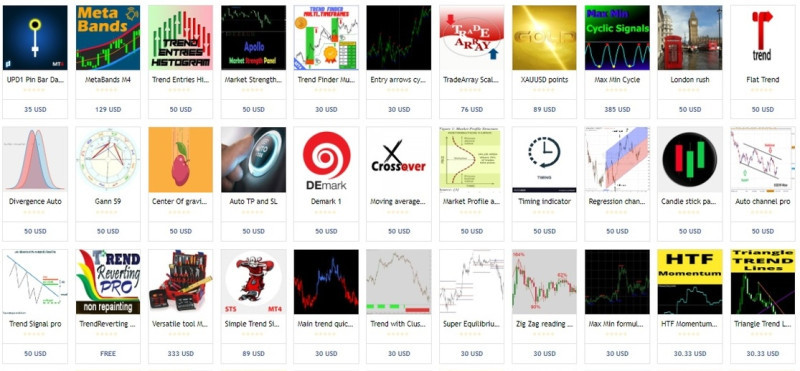
For instance, MetaBands is a new channel indicator created in 2022. It also can identify the current trend. MetaBands is compatible with other tools, has multiple time frames, and is effective when trading any currency pair.
It also supports all notification options, from sound to pop-up.
On the chart, MetaBands is represented as a blue trend line and two more lines of different colors limiting a price channel. The indicator generates a buy/sell signal at points where the trend line intersects one of the two other lines.
Importantly, this is a paid expert advisor for MT4, which can be downloaded on the MQL5.community website, where MetaTrader users can find many other useful tools.
Brokers, including InstaForex, sometimes also design their own indicators. Mostly, they are free for their clients.
In addition, you can purchase or get indicators, including new ones, in the MT4 Market. It offers over 2,000 trading tools.
In other words, there is a plethora of new indicators.
Still, new algorithms are not always 100% effective. It is mainly about the modifications of already known and tested tools.
Final thoughts
MT4 indicators are a rather broad topic. This article just covers the basics every trader should know. Still, practice is as important as knowledge.
No matter how perfect a tool can be, it will prove efficient when used properly.
The tools we have outlined in this article can just help you trade. Meanwhile, success in trading is solely your responsibility.
Read more
Bollinger Bands: strategy and way of use
MFI Indicator (Money Flow Index): complete guide
Awesome Oscillator: how to use
Support and Resistance Indicator MT4, MT5
VWAP Indicator (Volume Weighted Average Price)
Candlestick patterns Indicator for MT4, MT5
Forex volume indicators for MT4, MT5
Forex arrow indicators for MT4
Forex trend indicators: TOP 6 (complete guide)
Wolfe Waves: indicator and strategy


