


You cannot become a good mathematician without knowing all the laws and formulas of this science. In the same way, you cannot succeed in Forex without knowing the basics of technical analysis.
You can learn more about special algorithms, which are described in the article "Forex indicators".
In this article, we will talk about why we need volume indicators Forex, their uniqueness, and how novice traders and professionals can use these tools in the market.
Volume in trading
When it comes to such indicators, we mean algorithms that help traders to gain profits - the main goal of trading. As the name suggests, they use the volume (V) of assets in calculations.
The volume is a very important benchmark in the market. After all, it reveals how interesting the asset is to market players, that is, it demonstrates the supply and demand ratio.
When the price rises and there is a bullish trend, the V increases. On the contrary, when the trend reverses, it grows only when the price decreases.
Such a pattern is quite logical as players are trying to invest their money to get as much profit as possible, guided by the quotes. None of the market participants wants to buy an asset at a higher price and sell at a lower one.
At the same time, the main purpose of the V in trading is the anticipation of the value. That is, this indicator helps to build a prediction about further price movements.
In this regard, the situation can most often develop in two ways:
- the trend will continue;
- the trend will reverse.
For example, imagine that volume decreases during a bullish trend.
This tells us that the trend is likely to end soon. Traders should take this into account when building their trading plans.
The correlation between price and volume was first noticed by financier and journalist Charles Dow. Although some critics still question his theory, practice shows that this indicator still affects the quotes.
Having the data the indicator provides, a trader can confirm the existing trend in the market, as well as get a warning of its reversal.
What is V in trading? To put it simply, this term shows how much money is fixed at a certain level of value and at a specific period.
The asset can be securities, futures, currencies, etc. For example, if 100,000 shares are sold and bought per day, each worth $10, then the daily trading volume will be $1 million.
Most often this concept is applied to the stock market. However, in the forex market, it is slightly different.
The point is that it is almost impossible to calculate the volume in terms of money as Forex is not related to the exchange floors and it does not have a centralized statistical center. That is why when we speak about V on Forex we mean tick data, which we are going to discuss below.
Notably, there are two types of volumes on Forex:
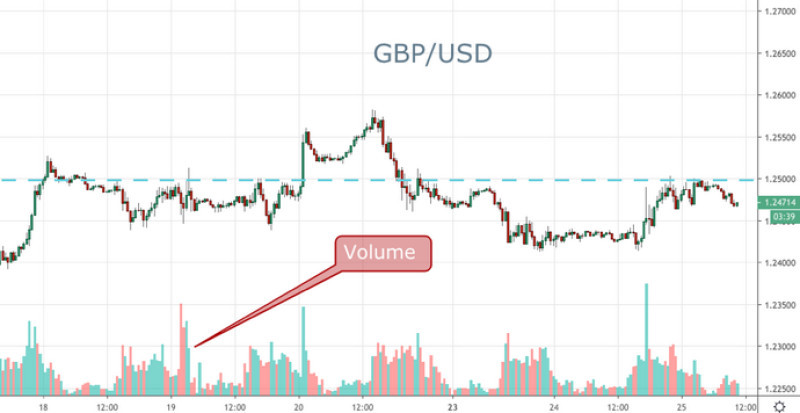
1. Vertical volume is most often represented by bars below the chart. They show the interest of traders in the asset for a certain period.
This type is considered the most common
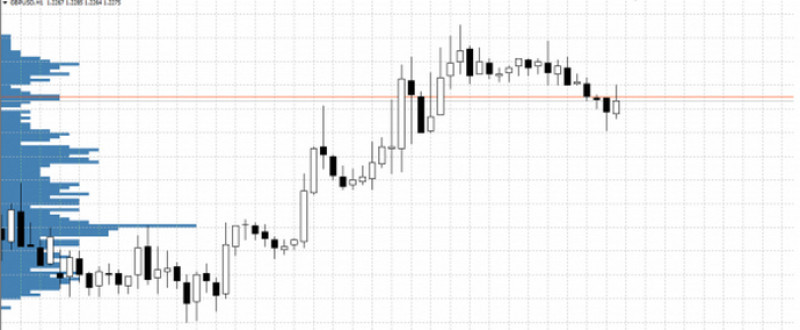
2. Horizontal volume is placed on the left side of the chart and is represented by a level scale. It shows the value of the asset, near which the players conducted the most transactions.
Thus, the longest bar shows the strongest and most significant price levels.
Both types can be used alone or paired with each other. This way the picture will be more complete.
Forex Volumes Indicators
Indicators are algorithms that are the result of the activity of traders, analysts, and programmers. Thanks to their joint efforts, market participants receive ready-made tools for trading.
Using various techniques, they scan charts’ performance and make it possible to assume the future direction of the quotes.
The algorithms of this group can show:
- trend continuation or reversal;
- important price areas;
- false breakout of support and resistance levels.
How does it work? Every time the price rises or falls, its movement becomes more significant and stronger if it is supported by appropriate volumes.
On the contrary, if this indicator shows weak figures, the price movement up or down cannot be called strong.
For example, with the help of the V indicator one wants to confirm the end of the trend. For this purpose, it is necessary to compare its ratio to the price in periods of strong trends and at the present moment.
If the indicator is declining, the trend is likely to fade. If not, it is likely to persist for some time.
When calculating volume algorithms can be used:
- real-time data, which are also called stock data. They show not only the number of positions but also the value in terms of money;
- tick data, which displays the number of ticks, i.e. price changes, per unit of time. Simply put, it is a kind of counter, which records the fluctuations of quotations without focusing on the monetary amount of each of the committed transactions.
We have already said that the second type of data is used for volume indicators on Forex. This means that we are talking about the number of ticks for a period of one bar or one candlestick and it has nothing to do with money.
Thus, such tools show the general activity of currency rate changes in the Forex market. This gives an opportunity to understand the demand for a particular asset and to predict its further movement.
Here is an example that explains in more detail the nature of this type of tool.
Let's assume that for a certain period, 50 trades were made, each amounting to $1. On the chart, we will see 50 ticks.
However, if there were only one trade and its volume was $50, the chart would then show only one tick.
It turns out that in monetary terms the volume is the same, but in teak terms it is different.
We can conclude that these indicators in the tick volume on Forex are relative. Both large and small positions are considered equivalent. Although they will affect the quotes differently.
At the same time, their role cannot be ruled out as the number of active players increases the importance and objectivity of these values. Simply put, there is a high probability that the weighted average data is still close to the real trading activity on Forex.
Volumes indicators
There are quite a few tick algorithms developed by now. The classic and tested variant are Volumes.
It is one of the most popular among market participants. Let's dwell on it in more detail.
Notably, the indicator is versatile in terms of trading terminals, time frames, and currency pairs. In addition, it is already built into MetaTrader 4 and MetaTrader 5, so users do not have to download and install it manually.
This tool counts ticks for the time interval, which the trader chooses. That is, it outputs the number of trades on Forex for a certain time. It is considered that each tick implies one trade.
As we mentioned above, indicators of this type do not show the amount of money invested in asset transactions. That is, regardless of whether it will be a small transaction from a cent account or a large position, the tick volume algorithm will show an equal value.
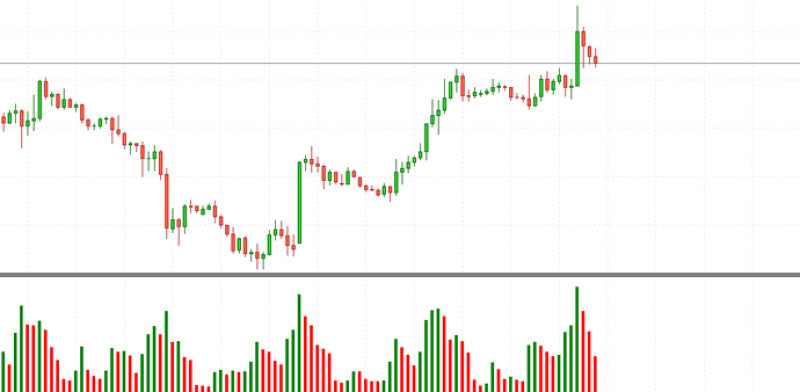
After the candlestick closes on the chart, a green or red bar is formed.
Meanwhile, the color does not depend on the direction in which the price of the currency pair changes. Here we take into account only the activity in the Forex market.
A red bar occurs when a new bar is lower than the one ahead, i.e. activity has decreased. On the contrary, a green bar appears when it is higher than the previous one, i.e. activity has increased.
The height of each bar depends on the number of ticks: the more it is, the higher the bar is.
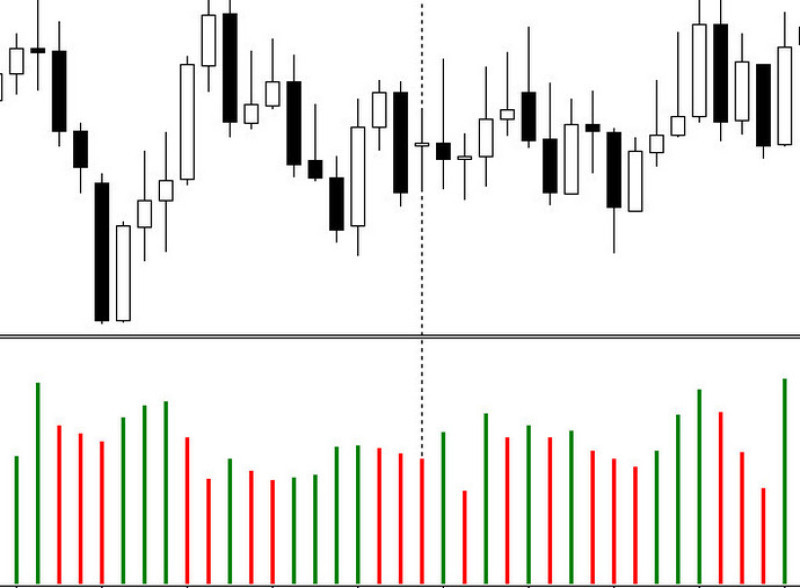
These data - the height and color of the bars - are important to consider when planning transactions on Forex.
How to apply indicator on MT4 and MT5
In order to use the Volumes algorithm in trading, you need to make a few simple steps:
- Go to the terminal menu in the Insert section and select the Indicators tab, then select Volumes;
- In the appeared drop-down list click the right mouse button on Volumes;
- After that, the trader needs to configure the algorithm, selecting the most suitable colors for the columns, as well as the levels, and display mode.
After confirming all the settings, the histogram will appear on the screen under the quotation chart.
Now let's move directly to the analysis of the signals produced by this algorithm. After all, the alternation of red and green bars, in fact, does not give specific indications about what action is worth doing.
There are four basic principles to keep in mind:
- If the height of bars, i.e. tick indicator, increases with the change of quotations, it means that the current trend with a high degree of probability will remain. If it is bullish, it is recommended that you open long positions, if it is bearish - short positions;
- When the height of bars is decreasing and the price is increasing, then the current trend is likely to end. It means that soon the trend may reverse or start to move sideways, i.e. it is better to postpone opening new positions until a correction begins;
- If the volume increases in the area of a breakthrough of a strong level, it means that the breakthrough is confirmed. If the opposite picture is observed, i.e. the volume is low, the breakout is probably a false one;
- The divergence of the indicator value and a histogram is a reversal signal.
Other indicators on MT4 and MT5
Several vertical volume algorithms are installed by default in MetaTrader 4. In addition to the Volumes indicator, which we described above, there are others.
They will be useful to both beginners and experienced traders in the Forex market.
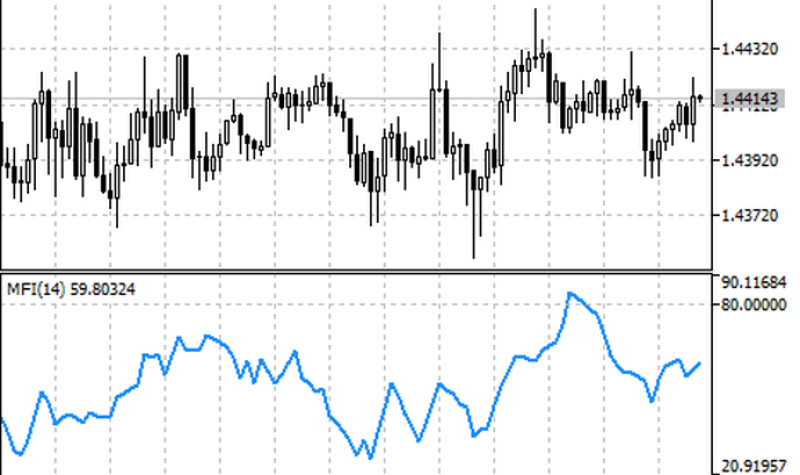
1. Developed by a group of traders in the late 80s, the Money Flow Index is suitable both for analyzing quotes on Forex and stock markets.
It is based on the intensity with which players invest and withdraw their funds from different assets. The result of the calculations is given in the form of the difference between them.
In other words, the tool calculates the pressure in the Forex market by bulls and bears. When the base price of the currency is less than the difference, bulls are controlling the market, when it exceeds the difference, bears are controlling it.
Many experts draw an analogy between this algorithm and the RSI. In the first case, volume is also used in calculations. The MFI can be used alone or in combination with other indicators.
Visually, this oscillator can vary in the range from 0 to 100.
Pros and cons of the Money Flow Index
| + | - |
|
|
How to understand the data:
- when the indicator approaches and exceeds 80, we can conclude that the currency pair is overbought. It means that it is better to refrain from opening long positions.
However, one cannot rule out that the pair’s direction may reverse.
If the indicator is below the level of 20, the pair is oversold. In this case, short positions should be out of consideration;
- The indicator has two key levels of 20 and 80. If the MFI breaks through them, it means that the market is at a low or high;
- Divergent movement of the indicator and the currency value: if the latter increases and the indicator decreases, it is possible to talk about a reversal. A similar is true when the indicator rises and the Forex quotations fall at the same time.
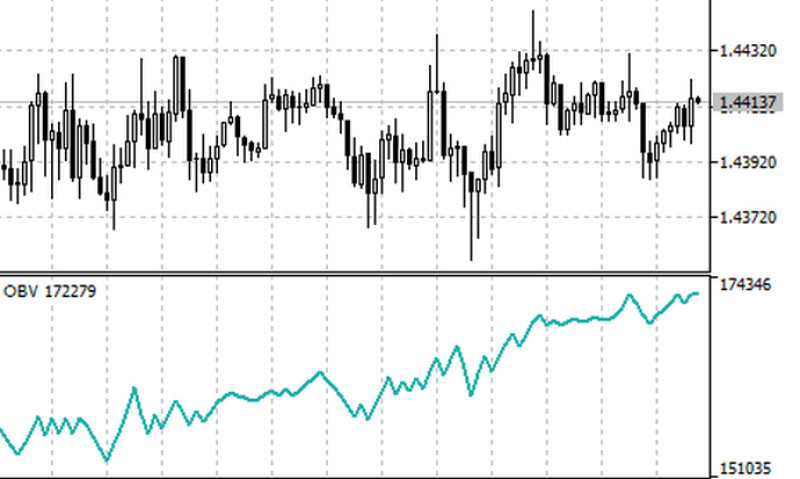
2. On-balance volume (OBV), presented by analyst and financial writer Joseph Granville in the 1960s. It is based on the study of money flows.
According to the author, the correlation between volume and price is based on the following principles:
- when the value of a candlestick or a bar exceeds the value of the preceding ones, then the V of the last two (the current and previous) are added;
- If the opposite is true, the values of the corresponding V values are subtracted;
- if the price does not change, a horizontal line appears on the chart;
- the change of the balanced V occurs before the price correction. In other words, it is supposed to grow initially due to the whales' entry into the market, and then other players start to follow suit.
As a result, the value also goes up. When large investors dispose of assets in this way, the same picture appears.
To use this indicator on Forex, you need to read its signals correctly:
- If the value of the asset moves faster than the OBV, it means that the uptrend has peaked or the downtrend has reached its base. The difference is in which direction the price is moving. If it moves up, it's the first situation. If it decreases, it's the second one;
- If the trend is bullish, the OBV highs or lows are increasing, if it is bearish, they are decreasing;
- When there is no increase or decrease of the indicator on the chart, it means that the situation is ambiguous and it is worth waiting for a breakout;
- If the OBV reverses, it is better to open long positions, when the direction becomes upward. If the indicator drops, it is better to sell the asset.
After a change in the trend, positions should be closed.
Meanwhile, one should not forget about the existing difference between tick volumes and money volumes. In the case of OVB, it is the former that is used.
This means that this indicator should not be used on lower time frames. For example, less than a day. This way the V indicators will come to an approximate equilibrium;
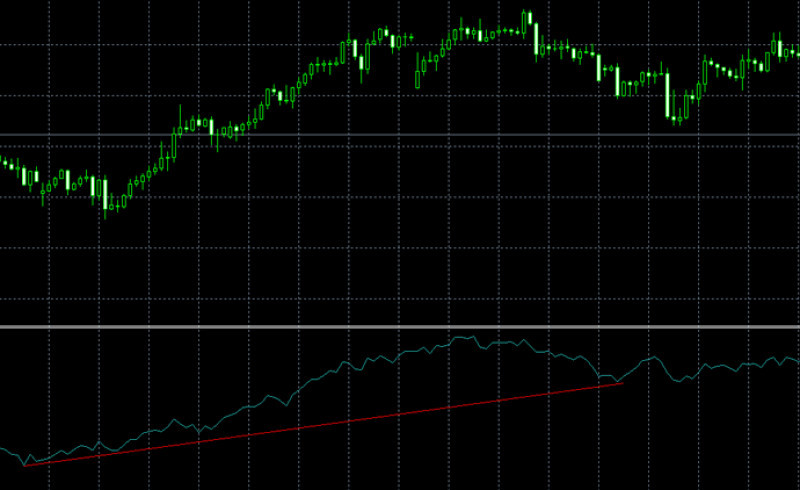
3. The Accumulation/Distribution indicator was developed by stock analyst Marc Chaikin in the 1980s. Initially, it was created exclusively for stock exchange participants but over time, it was adopted by Forex traders.
This algorithm is based on the interaction of cost and V, which is different from the version of WAD developed by Bill Williams.
The Accumulation/Distribution indicator represents a line, which shows the supply and demand ratio in the currency market. In other words, it answers the question: do bulls or bears prevail in the market?
When the indicator line is moving upwards, there are more sales in the market. If the picture is otherwise, the number of purchases exceeds the number of sales.
How to understand the indicator’s signals:
- the trend is confirmed when the chart of value and AD have the same direction;
- if the value decreases and the indicator line is moving upwards, one should expect an increase in price, i.e. a reverse of a downtrend;
- when the price increases and the indicator line, on the contrary, is moving downwards, a reversal is coming.
Like the previous variants, this methodology implies the use of tick data in volume calculations. This means that you should not use lower time frames to get more objective signals.
In addition, quite often there are situations where the ratio of AD to the value of the asset is fixed and held at the same level. In this case, traders need to take pause and wait for the divergence, which will indicate a reversal.
Forex volume indicators for MetaTrader
In addition to the algorithms that are already installed in the MT4 and MT5 platforms, there are many other V indicators.
Let's take a look at them in more detail:
- TPO, which is represented by two variants: classic and modified TPO Range. The first one is focused on intraday trading on lower time frames, the second one is designed for traders who prefer medium and long-term trading.
The best solution is to use both. To do this, you can add TPO to the trading chart, and an updated version of this algorithm to a higher time frame.
Both versions are free of charge and are compatible with the MT4 terminal.
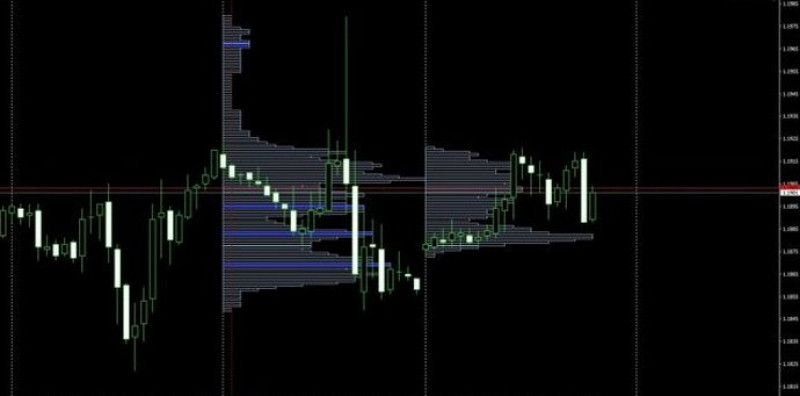
This algorithm shows tick volume in a separate window for a particular candlestick or bar or for a whole period. It is a horizontal V indicator, its data are presented as a histogram.
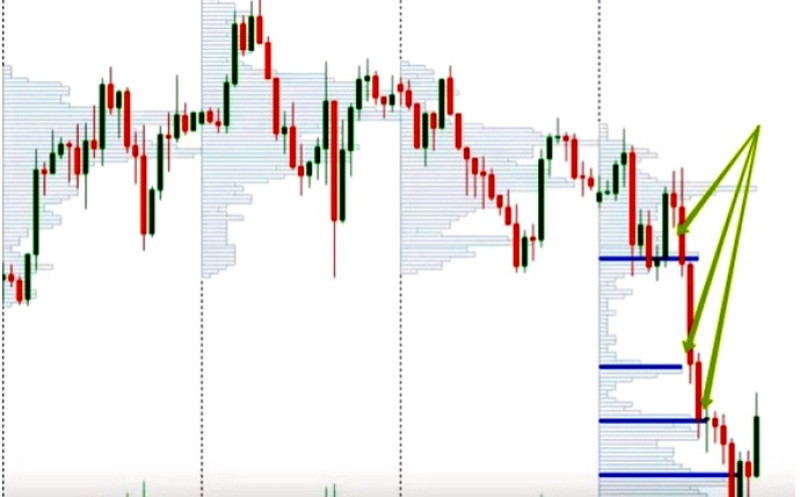
The highest tick values are highlighted in blue. This is an indication that support or resistance is very strong, i.e. the price is near key levels.
In the Range version, the indicator is green.
The indicator does not draw points in which long or short positions can be opened. It only helps to determine a trend, as well as strong support and resistance levels.
This is what traders should use on Forex.
For example, if the indicator shows the same values on different time frames, it means that the level is really strong. Thus, this price level is suitable for opening a trade.
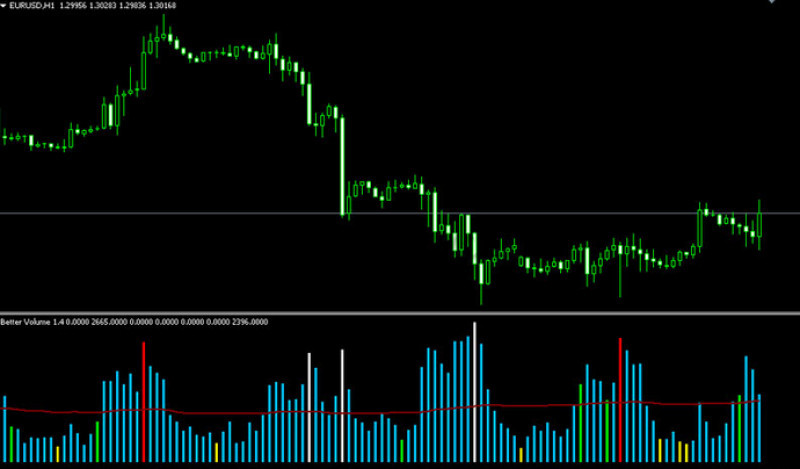
2. The Better Volume indicator is an advanced version of the Volumes indicator, which we talked about at the beginning of the article. It also does not give clear signals regarding the entry points but it is used to confirm trading signals.
On the chart, it represents bars colored in different colors and heights.
The chart is usually dominated by blue bars. This is a familiar market condition when tick volumes are in the range of standard values.
This means that the trend is unlikely to change.
Red bars are catchy not only because of their color but often because of their height. It is a sign that bulls dominate in the market.
Following this scenario, we should expect a trend reversal from a downtrend to an uptrend.
The green bars also confirm increased V. At the same time, their corresponding candlesticks are usually small.
All this suggests that big players are entering the market. After that, the trend direction may change but the probability of inert movement for some time is not excluded.
White bars are the opposite of red bars. That is, their appearance indicates the dominance of bears, which most often ends with the change of the uptrend to the downtrend.
As a rule, yellow bars are of minimum height. For traders, this can be a clue that the tick V is very small, which means that the trend is exhausting.
Besides, the Better Volume indicator also displays the MA line, which goes through all the bars.
Experts recommend turning off some colored bars in the settings to prevent traders from misleading. Another option is to examine the chart as a whole, paying attention only to the highest and lowest bars.
However, this can only be applied if you prefer wave trading.
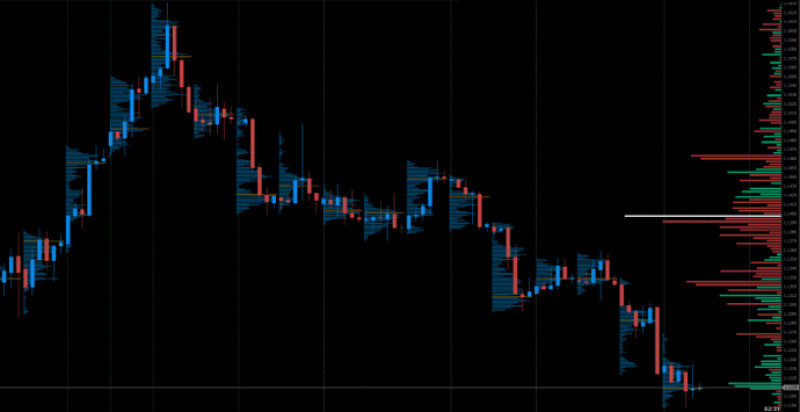
3. High Volume Bar resembles the previous indicator. It works with the MT4 and MT5 platforms. It is based on the V cluster analysis, which implies taking into account whales’ activity in the market.
After all, big market players often determine the direction of quotations.
The main distinguishing feature of this algorithm is that its V data remains the same if you change a time frame. Thanks to this indicator, traders can define the support and resistance levels, as well as the uncertainty areas.
Moreover, it shows the volumes for the past periods and at the present moment. This is another feature of the High Volume Bar indicator.
Notably, each level has its own color.
Trading using this indicator is based on the principles of basic trend strategies.
In addition, there is an upgraded version of this indicator - High Volume Bar v2. There is no big difference between them but the second version provides data not only in absolute numbers but also in percentages.
How to add indicators to your trading platform
We already noted that some of the described indicators are installed by default in trading platforms. To start using them, you only need to turn them on.
We have described how to do it above.
In the review, we dwell on other options, which are not included in trading platforms but can be easily added. Let's consider the main actions that a trader needs to do.
- Download the indicator to your device. Most often, it is an archive, so the folder with the data must be unzipped;
- Go into the MT4 or MT5 trading platform, click the File menu, and open the folder with the indicator;
- In the folder, select MQL4 or MQL5, depending on what version of the platform you use, and in this tab, select the Indicators folder. Here you can see all the indicators that have been added to the platform;

- Copy the downloaded indicator in MQL4/EX4 or MQL5/EX5 format and paste it into the list of those already in the platform;
- Restart the trading platform.
In order to use an installed indicator in trading, you need to go to Insert - indicators - Custom in the platform. Select the indicator in the list.
Notably, MetaTrader 4 and 5 have their own stores, where you can purchase or download free V indicators. You can select the variants in the Market menu.
Pros and cons
Quite often even the prospect of using mathematical algorithms in trading, including volume, causes traders to feel confused and scared. Beginners often have such feelings.
As soon as traders hone their skills using the indicators, the situation changes. Each market participant forms their set of the most effective trading tools, with the help of which they implement their trading ideas.
The advantages of using the V indicators:
- allow traders to determine a trend in the market;
- increase the efficiency of trading;
- can be used to confirm signals given by other indicators;
- availability: several indicators are included in MetaTrader, others can be downloaded from public sources;
- simplify trading and reduce risks;
- help traders find the best entry and exit points.
Notably, these tools, like all the others, do not give a clear answer about the moment to enter the market. In addition, their effectiveness largely depends on the skill of a trader.
After all, no matter how accurate the indicator is, quite often it moves behind the value of the asset. The ability to catch signals in a timely manner is formed through long training.
Another significant disadvantage of volume algorithms is that they can show wrong signals in short-term trading - scalping and intraday trading. That is why it is better to use them for long-term and medium-term trading.
Besides, one should not forget that the tick V is not an indicator expressed in money. In this case, we are talking about the number of changes in the value for a specific period.
Despite its relativity, it allows traders to properly build their strategies, following such a fundamental principle as "smart money movement." After all, behind the number of ticks is the number of trades, which reflects the level of interest in one currency or another.
Basic rules on how to use Forex volumes indicators
In order to summarize the information about the Volume indicators, let's focus on the principles that will help reduce the risks of trading and increase the chances of getting the desired result.
- The decrease of tick V on Forex proves that traders are losing interest in the asset. This can indicate either an imminent consolidation, in which the market will remain for some time or an impending reversal;
- When the volume increases, the currency is in high demand. In such a case, the current trend will most likely remain or the trajectory will sharply change its direction;
- If there is a clear bullish trend and the tick V is decreasing, a correction or a change of direction can be expected;
- The tick volume growth along with the price shows the stability of the uptrend. On the contrary, when quotes decrease, the downtrend is confirmed;
- You should not experiment and use only one algorithm in trading. For example, you can use the Stochastic Oscillator, the Moving Average, or the Relative Strength Index together with the V indicators;
- Before trading with the volume indicators for real money, it is important to practice on a demo account. This will form the initial trading experience and allow you to evaluate and adjust your trading strategy.
Conclusion
At first glance, the Forex market seems inscrutable and difficult to understand. In spite of its scale, it functions according to certain rules, which are formed by traders.
After all, behind each transaction is a real person, who in tandem with other market participants is the main driving force in the formation of supply and demand. Forex volume indicators, along with other ones, help understand these patterns and the essence of trading in general.
We have already mentioned that Forex does not have a single statistics center, which would publish reports on trades in money terms. Therefore, traders have access only to the tick V, moreover, most often it is the data of a particular brokerage company, with which traders interact to trade on Forex.
Nevertheless, this is an important indicator, which should not be ignored in trading. The methods that we described in our article will help us understand them correctly for successful trading.
Read more
Bollinger Bands: strategy and way of use
MFI Indicator (Money Flow Index): complete guide
Awesome Oscillator: how to use
Support and Resistance Indicator MT4, MT5
VWAP Indicator (Volume Weighted Average Price)
MT4 indicators: how to install and use
Candlestick patterns Indicator for MT4, MT5
Forex arrow indicators for MT4


