empty
24.11.2023 08:15 PM
Technical analysis on USD/CAD on November 24, 2023

This image is no longer relevant

Overview :

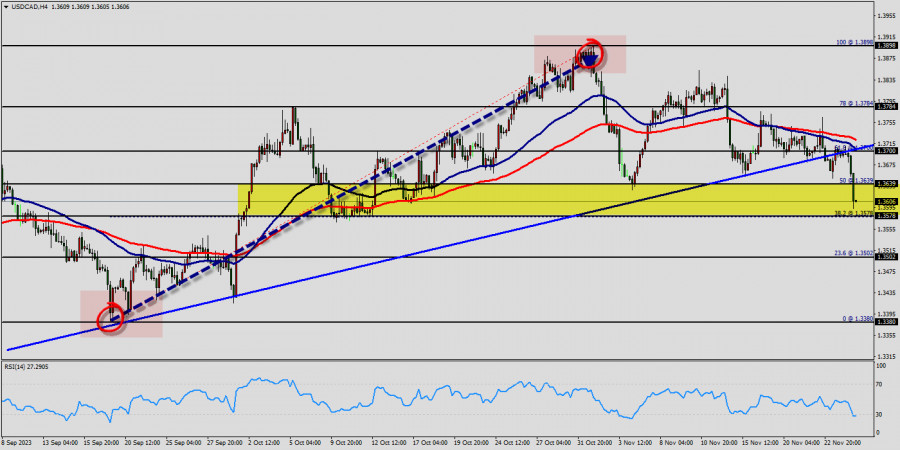
The USD/CAD pair broke resistance which turned to strong support at the level of 1.3578 yesterday. The level of 1.3578 coincides with a golden ratio (38.2% of Fibonacci), which is expected to act as major support today. The Relative Strength Index (RSI) is considered overbought because it is above 30. The RSI is still signaling that the trend is upward as it is still strong above the moving average (100).

The USD/CAD pair is continuing in a bullish market from the support levels of 1.3502 and 1.3578. Also, it should be noted that the current price is in a bullish channel. Equally important, the RSI is still signaling that the trend is upward as it is still strong above the moving average (100) since yesterday.

Immediate support is seen at 1.3578 which coincides with a golden ratio (38.2% of Fibonacci). Consequently, the first support sets at the level of 1.3578. So, the market is likely to show signs of a bullish trend around the spot of 1.3578/1.3502. It is also worth noting that the price at 1.3502 will possibly form a strong support.

This suggests the pair will probably go up in coming hours. Accordingly, the market is likely to show signs of a bullish trend. The level of 1.3784 will act as strong resistance and the double top is already set at the point of 1.3898.

In other words, buy orders are recommended above 1.3578 with the first target at the level of 1.3639. From this point, the pair is likely to begin an ascending movement to the point of 1.3700 and further to the level of 1.3784.

On the other hand, if a breakout happens at the support level of 1.3502, then this scenario may become invalidated.

Forecast :

According to the previous events, the USD/CAD pair is still moving between the levels of 1.3502 and 1.3784; for that we expect a range of 282 pips (1.3784 - 1.3502) in coming days.

If the USD/CAD pair fails to break through the resistance level of 1.3700, the market will decline further to 1.3502. This would suggest a bearish market because the RSI indicator is still in a positive area and does not show any trend-reversal signs. The pair is expected to drop lower towards at least 1.3308 with a view to test the daily pivot point.

Pilih carta masa
5
min
15
min
30
min
1
jam
4
jam
1
hari
1
minggu
Jana pendapatan melalui perubahan kadar mata wang kripto dengan InstaForex.
Muat turun MetaTrader 4 dan buka dagangan pertama anda.
  • Grand Choice
    Contest by
    InstaForex
    InstaForex always strives to help you
    fulfill your biggest dreams.
    SERTAI PERADUAN

Artikel yang dicadangkan

GBP/USD – 13 Mei: Kadar Pengangguran di UK Meningkat Semula

Pada carta setiap jam, pasangan GBP/USD telah jatuh ke tahap 1.3139 pada hari Isnin, kemudian pulih daripadanya, dan naik ke paras Fibonacci 100.0% pada 1.3205. Pemulihan daripada tahap ini akan

Samir Klishi 10:49 2025-05-13 UTC+2

Ramalan EUR/USD untuk 13 Mei 2025

Peristiwa utama semalam yang sedikit membingungkan pasaran ialah persetujuan antara AS dan China untuk kembali kepada tarif bersama yang ada sebelum 2 April. Ini bermakna tarif barangan China akan dikurangkan

Laurie Bailey 04:49 2025-05-13 UTC+2

Ramalan GBP/USD untuk 13 Mei 2025

Menjelang akhir dagangan semalam, pound British telah merosot sebanyak 129 pip, susulan kenaikan 1.43% dalam indeks dolar. Julat sokongan 1.3184–1.3208 telah ditembusi, dan pergerakan tersebut berhenti di garis penunjuk imbangan

Laurie Bailey 04:49 2025-05-13 UTC+2

Ramalan USD/JPY untuk 13 Mei 2025

Pasangan USD/JPY mencatat pergerakan yang tajam dan kukuh semalam, melonjak lebih daripada tiga angka dan mencapai dengan tepat paras sasaran 148.66, iaitu paras terendah sejak Disember lalu. Helahnya terletak pada

Laurie Bailey 04:49 2025-05-13 UTC+2

Isyarat Dagangan untuk BITCOIN bagi 12-15 Mei, 2025: jual di bawah $106,250 (200 EMA - 21 SMA)

Pada awal sesi Amerika, Bitcoin didagangkan sekitar $104,250, di atas 21st SMA dan dalam saluran aliran menaik yang dibentuk pada 4 Mei. Kami melihat tanda-tanda keletihan. Dalam beberapa sesi perdagangan

Dimitrios Zappas 17:34 2025-05-12 UTC+2

Isyarat Dagangan EUR/USD untuk 12-15 Mei 2025: beli di atas 1.1080 (200 EMA - 6/8 Murray)

Pada awal sesi dagangan Amerika, pasangan EUR/USD didagangkan sekitar paras 1.1123, melonjak selepas mencecah dasar saluran aliran menurun. Keadaan pasaran kini menunjukkan isyarat terlebih beli. Pada pembukaan dagangan minggu

Dimitrios Zappas 17:33 2025-05-12 UTC+2

EUR/USD. 12 Mei. Konflik Ukraine mungkin dapat diselesaikan

Selamat sejahtera, pedagang yang dihormati! Pada hari Jumaat, pasangan EUR/USD meningkat ke zon rintangan 1.1265–1.1282, melantun semula, dan berpaling memihak kepada dolar A.S. Pergerakan menurun mungkin berterusan hari ini menuju

Samir Klishi 10:04 2025-05-12 UTC+2

GBP/USD. 12 Mei. Perjanjian Perdagangan Pertama Trump

Selamat sejahtera, para pedagang yang dihormati! Pada carta satu jam, pasangan GBP/USD pada hari Jumaat hampir melengkapkan lantunan dari paras anjakan semula Fibonacci 100.0% pada 1.3205, disertai pembalikan memihak kepada

Samir Klishi 10:04 2025-05-12 UTC+2

Ramalan untuk EUR/USD pada 9 Mei, 2025

Pada hari Khamis, pasangan EUR/USD melonjak semula daripada tahap pembetulan Fibonacci 76.4% pada 1.1338, berpihak kepada dolar AS, dan jatuh di bawah zon sokongan 1.1240–1.1265. Lantunan dari zon ini dari

Samir Klishi 11:24 2025-05-09 UTC+2

GBP/USD. 9 Mei. Bank of England Tidak Menyokong Kenaikan Harga

Pada carta satu jam, pasangan GBP/USD pada hari Khamis membentuk dua lantunan dari paras anjakan semula Fibonacci 127.2% pada 1.3344, kemudian beralih memihak kepada dolar AS dan menurun ke paras

Samir Klishi 11:22 2025-05-09 UTC+2
Tidak boleh bertanya sekarang?
Tanya soalan anda di Ruangan bersembang.
Panggilan semula Widget
 

Dear visitor,

Your IP address shows that you are currently located in the USA. If you are a resident of the United States, you are prohibited from using the services of InstaFintech Group including online trading, online transfers, deposit/withdrawal of funds, etc.

If you think you are seeing this message by mistake and your location is not the US, kindly proceed to the website. Otherwise, you must leave the website in order to comply with government restrictions.

Why does your IP address show your location as the USA?

  • - you are using a VPN provided by a hosting company based in the United States;
  • - your IP does not have proper WHOIS records;
  • - an error occurred in the WHOIS geolocation database.

Please confirm whether you are a US resident or not by clicking the relevant button below. If you choose the wrong option, being a US resident, you will not be able to open an account with InstaForex anyway.

We are sorry for any inconvenience caused by this message.