GBP/USD
Brief Analysis:
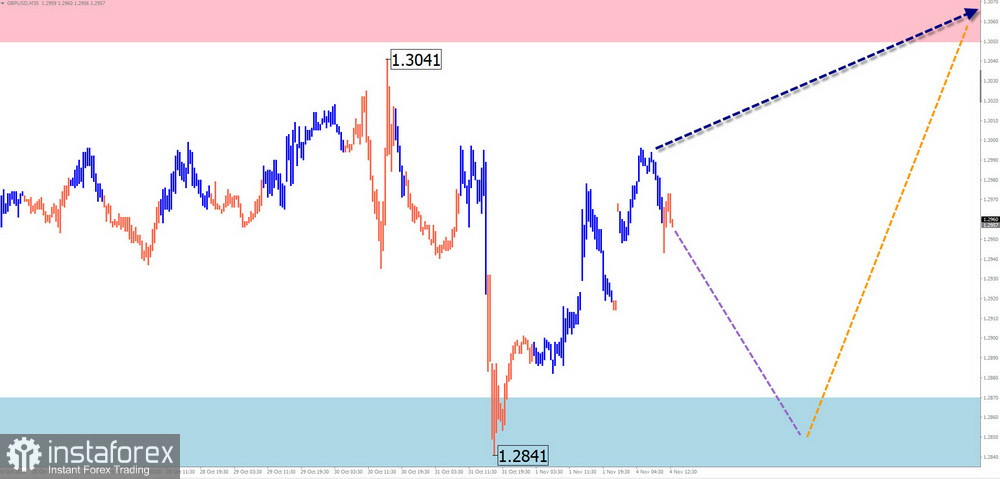
The direction of the short-term trend for the British pound since the end of August this year has been set by a bearish wave in the form of an extended horizontal flat. The structure of this wave is nearing completion. The price is close to the upper boundary of a significant potential reversal zone on the weekly chart.
Weekly Forecast:
The start of this week is expected to be more flat compared to the previous section. Price movements for the British pound are likely to remain within a sideways range along the support zone. Increased activity and the start of an upward trend can be expected in the second half of the week.
Potential Reversal Zones
Resistance:
Support:
Recommendations
Buying: Can be considered after signals from your trading systems appear around the support zone.
Selling: Permissible with fractional volumes during individual sessions.
AUD/USD
Brief Analysis:
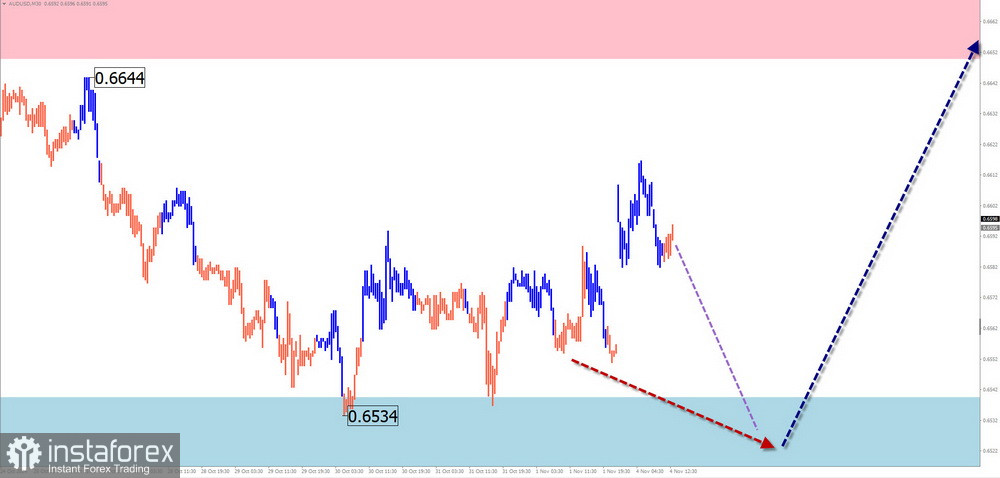
Since the end of last year, the Australian dollar has been forming a horizontal downward flat on the chart. The structure of this wave is developing its final segment. The price has reached strong support. Wave analysis suggests the need for an intermediate correction.
Weekly Forecast:
At the start of the upcoming week, sideways movement along the support boundaries with a downward vector is more likely. Later, the probability of a directional change and a short-term price increase rises. The price is expected to rise no further than the calculated resistance. Increased volatility can be expected closer to the weekend.
Potential Reversal Zones
Resistance:
Support:
Recommendations
Selling: Due to limited potential, these trades may be risky. It is wiser to reduce the trading volume.
Buying: Will become relevant after corresponding signals from your trading systems appear around the support zone.
USD/CHF
Brief Analysis:
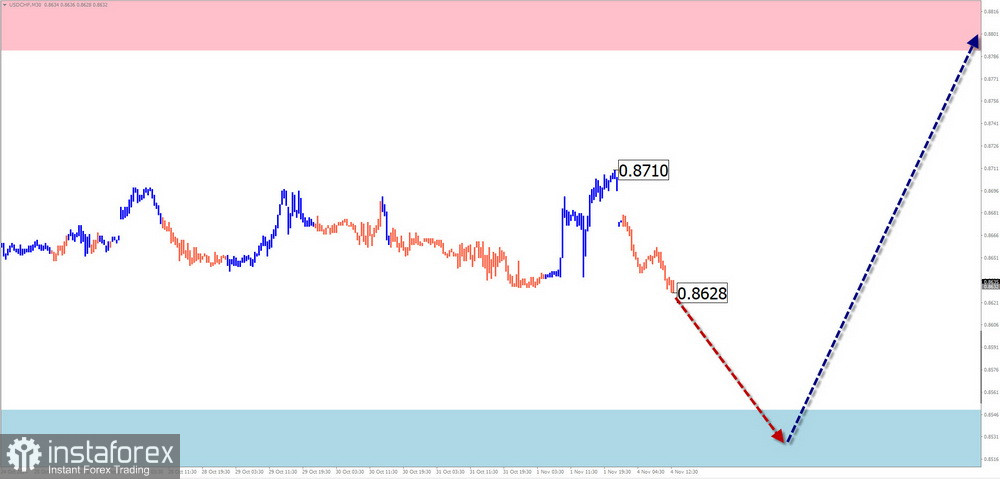
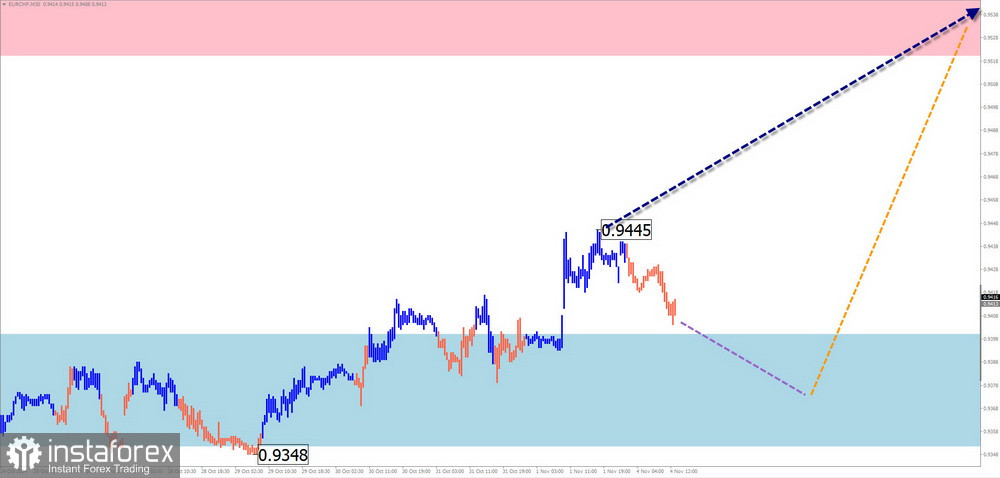
The 4-hour chart analysis for the Swiss franc shows the formation of an upward wave model since August 5. The bullish section of the chart that started on September 30 marks the beginning of the final part (C) of this wave. The nearest target is the preliminary target zone, with the lower boundary marked by the calculated resistance level.
Weekly Forecast:
In the first days of the upcoming week, the pair's price is expected to move sideways. A brief decline to the support zone is possible. A trend reversal, brief consolidation, and upward movement toward the resistance zone can be expected afterward. The highest volatility is expected in the second half of the week.
Potential Reversal Zones
Resistance:
Support:
Recommendations
Selling: Not relevant in the coming days.
Buying: Can be considered after confirmed signals appear in the support zone.
EUR/JPY
Brief Analysis:
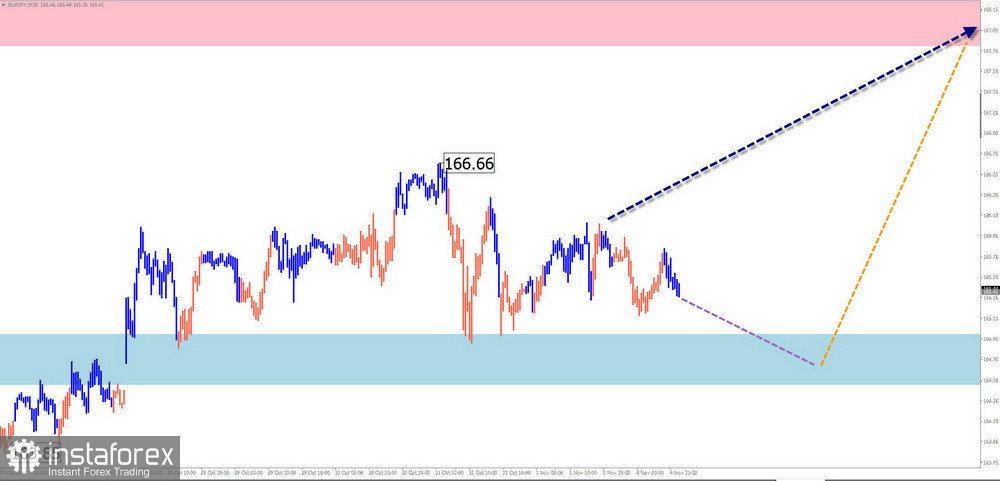
The current wave structure of the EUR/JPY pair has been directed upward over the last three months. The ongoing wave started on September 16. For the past few weeks, the price has formed an intermediate correction. Its structure is not complete at the time of analysis.
Weekly Forecast:
For the next few days, a sideways trend with price movement along the support zone is expected. Continued growth of the pair's rate is likely in the second half of the week amid increased volatility. The upper boundary of the expected weekly range is shown by the calculated resistance.
Potential Reversal Zones
Resistance:
Support:
Recommendations
Selling: High-risk and may result in losses.
Buying: Can be considered after reversal signals from your trading systems appear around the support zone.
EUR/CHF
Brief Analysis:
The direction of the EUR/CHF pair since early August has been set by an upward wave algorithm. An upward section with reversal potential began developing a decade ago. If confirmed, it will mark the start of the final part (C).
Weekly Forecast:
A continuation of the general upward trend is expected over the week. A brief decline is possible in the early days but not below the support. The highest activity is expected toward the weekend. A breakout beyond the calculated weekly range is unlikely.
Potential Reversal Zones
Resistance:
Support:
Recommendations
Selling: May be used intraday with fractional volumes.
Buying: Premature without confirmed signals in the calculated support zone.
US Dollar Index
Brief Analysis:
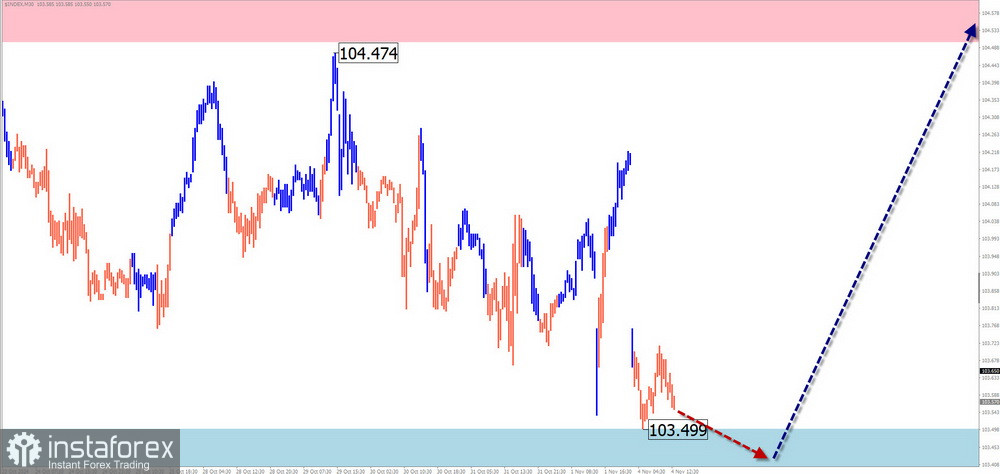
Since the end of last year, the U.S. Dollar Index has developed an upward flat. Since the end of September, quotes have formed an upward section from a strong support zone, marking the start of the final part (C). The need for an intermediate correction is apparent at the time of analysis. The index values are moving within a narrow price corridor.
Weekly Forecast:
For the next few days, the index is expected to continue moving sideways along the calculated support. A reversal and a resumption of upward movement can be expected afterward. The maximum resistance zone indicates the peak of the index's potential weekly rise.
Potential Reversal Zones
Resistance:
Support:
Recommendations
Buying: Possible with reduced volume sizes during individual sessions.
Selling national currencies: Will become relevant after the current index correction is complete.
Explanations: In simplified wave analysis (SWA), all waves consist of three parts (A-B-C). The last incomplete wave is analyzed on each timeframe. Dashed lines indicate expected movements.
Note: The wave algorithm does not consider the duration of price movements in time.