signal strength 1 of 5

According to the chart of M5, NZDUSD formed the Inverse Head and Shoulder pattern. The Head’s top is set at 0.5723 while the median line of the Neck is found at 0.5705/0.5719. The formation of the Inverse Head and Shoulder pattern evidently signals a reversal of the downward trend. In other words, in case the scenario comes true, the price of NZDUSD will go towards 0.5738
The M5 and M15 time frames may have more false entry points.
See Also
- All
- Double Top
- Flag
- Head and Shoulders
- Pennant
- Rectangle
- Triangle
- Triple top
- All
- #AAPL
- #AMZN
- #Bitcoin
- #EBAY
- #FB
- #GOOG
- #INTC
- #KO
- #MA
- #MCD
- #MSFT
- #NTDOY
- #PEP
- #TSLA
- #TWTR
- AUDCAD
- AUDCHF
- AUDJPY
- AUDUSD
- EURCAD
- EURCHF
- EURGBP
- EURJPY
- EURNZD
- EURRUB
- EURUSD
- GBPAUD
- GBPCHF
- GBPJPY
- GBPUSD
- GOLD
- NZDCAD
- NZDCHF
- NZDJPY
- NZDUSD
- SILVER
- USDCAD
- USDCHF
- USDJPY
- USDRUB
- All
- M5
- M15
- M30
- H1
- D1
- All
- Buy
- Sale
- All
- 1
- 2
- 3
- 4
- 5

The Double Bottom pattern has been formed on EURNZD M5. Characteristics: the support level 1.8799; the resistance level 1.8817; the width of the pattern 18 points. If the resistance level
The M5 and M15 time frames may have more false entry points.
Open chart in a new window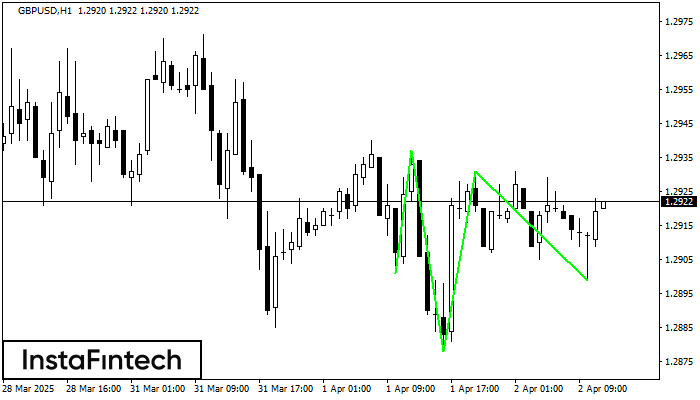
According to H1, GBPUSD is shaping the technical pattern – the Inverse Head and Shoulder. In case the Neckline 1.2937/1.2931 is broken out, the instrument is likely to move toward
Open chart in a new window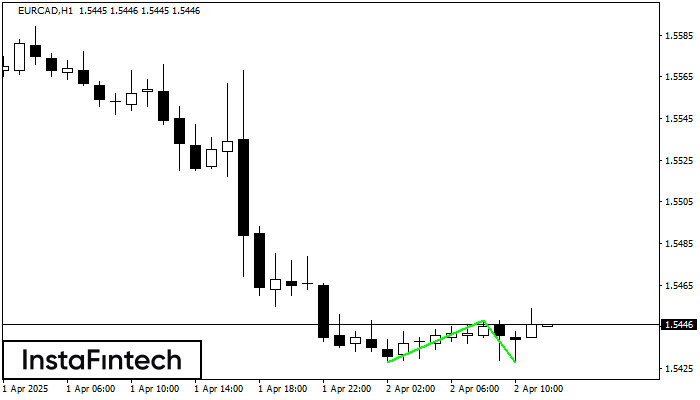
The Double Bottom pattern has been formed on EURCAD H1; the upper boundary is 1.5448; the lower boundary is 1.5428. The width of the pattern is 20 points. In case
Open chart in a new window