signal strength 1 of 5
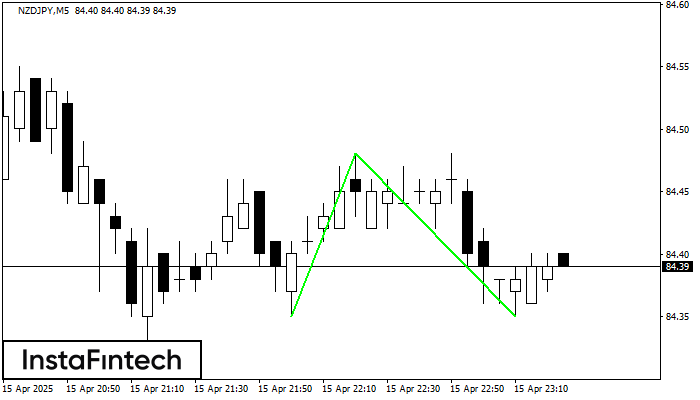
The Double Bottom pattern has been formed on NZDJPY M5. Characteristics: the support level 84.35; the resistance level 84.48; the width of the pattern 13 points. If the resistance level is broken, a change in the trend can be predicted with the first target point lying at the distance of 13 points.
The M5 and M15 time frames may have more false entry points.
Veja também
- All
- Double Top
- Flag
- Head and Shoulders
- Pennant
- Rectangle
- Triangle
- Triple top
- All
- #AAPL
- #AMZN
- #Bitcoin
- #EBAY
- #FB
- #GOOG
- #INTC
- #KO
- #MA
- #MCD
- #MSFT
- #NTDOY
- #PEP
- #TSLA
- #TWTR
- AUDCAD
- AUDCHF
- AUDJPY
- AUDUSD
- EURCAD
- EURCHF
- EURGBP
- EURJPY
- EURNZD
- EURRUB
- EURUSD
- GBPAUD
- GBPCHF
- GBPJPY
- GBPUSD
- GOLD
- NZDCAD
- NZDCHF
- NZDJPY
- NZDUSD
- SILVER
- USDCAD
- USDCHF
- USDJPY
- USDRUB
- All
- M5
- M15
- M30
- H1
- D1
- All
- Buy
- Sale
- All
- 1
- 2
- 3
- 4
- 5
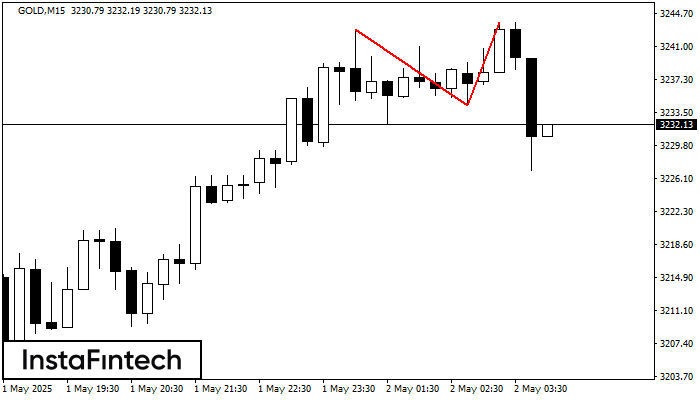
No gráfico de GOLD M15 o padrão de reversão Topo duplo foi formado. Características: o limite superior 3243.76; o limite inferior 3234.33; a largura do padrão 943 pontos. O sinal
Os intervalos M5 e M15 podem ter mais pontos de entrada falsos.
Open chart in a new window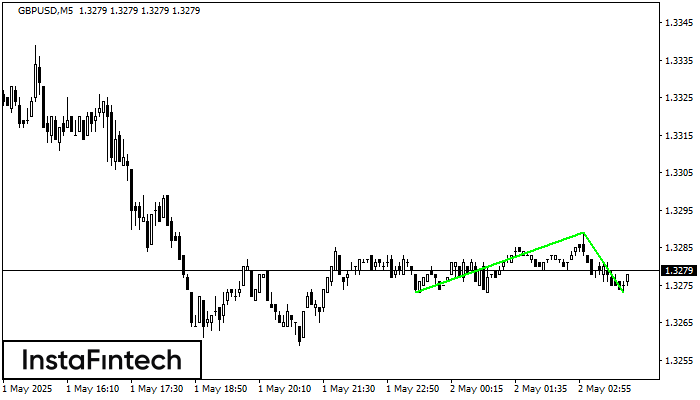
O padrão Fundo duplo foi formado em GBPUSD M5. Esta formação sinaliza uma reversão da tendência de baixo para cima. O sinal é que uma negociação de compra deve
Os intervalos M5 e M15 podem ter mais pontos de entrada falsos.
Open chart in a new window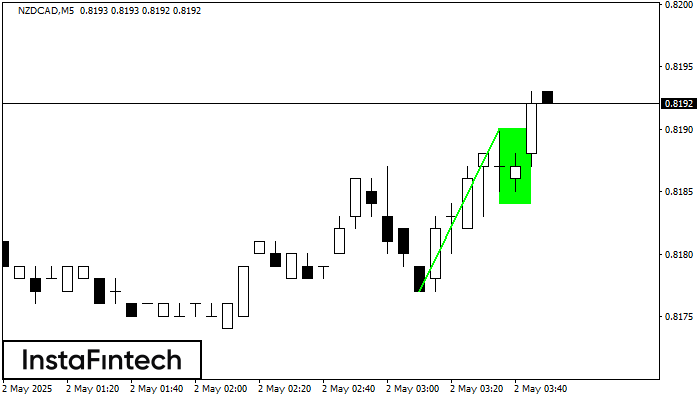
O padrão Bandeira de Alta foi formado em NZDCAD a M5. O limite inferior do padrão está localizado em 0.8184/0.8184, enquanto o limite superior está em 0.8190/0.8190. A projeção
Os intervalos M5 e M15 podem ter mais pontos de entrada falsos.
Open chart in a new window